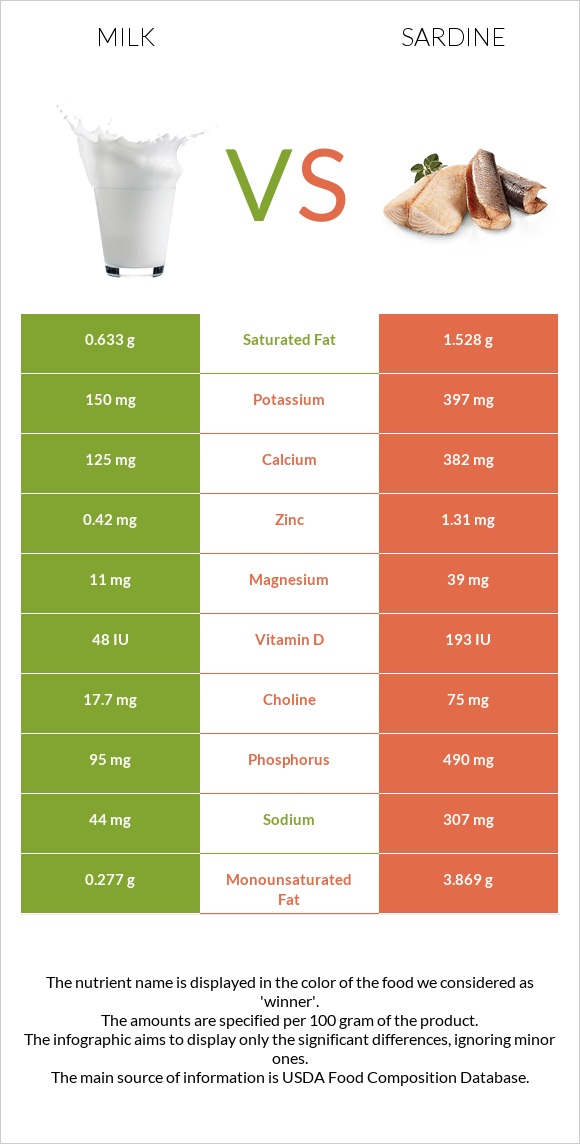
Significant differences between milk and sardines The amount of vitamin B12, selenium, phosphorus, iron, vitamin B3, calcium, copper, vitamin D* and vitamin E in sardines is higher than in milk. Sardines cover your daily vitamin B12 needs 353% more than milk. Milk contains less cholesterol. Milk has a higher glycemic index. The glycemic index of milk is 31, while the glycemic index of sardines is 0. Specific food types used in this comparison are Milk, lowfat, fluid, 1% milkfat, with added vitamin A and vitamin D and Fish, sardine, Atlantic, canned in oil, drained solids with bone .
Infographic
Mineral Comparison
Mineral comparison score is based on the number of minerals by which one or the other food is richer. The "coverage" charts below show how much of the daily needs can be covered by 300 grams of the food.
1
100 g
300 g
1 fl oz - 30.5g 1 cup - 244g 1 quart - 976g
Magnesium
Magnesium
Calcium
Calcium
Potassium
Potassium
Iron
Iron
Copper
Copper
Zinc
Zinc
Phosphorus
Phosphorus
Sodium
Sodium
Manganese
Manganese
Selenium
Selenium
7.9%
38%
13%
1.1%
3.3%
11%
41%
5.7%
0.39%
18%
9
100 g
300 g
1 small (2-2/3" x 1/2" x 1/4") - 12g 1 cubic inch - 16g 2 sardines - 24g 1 oz - 28.35g 1 can (3.75 oz) - 92g 1 cup, drained - 149g
Magnesium
Magnesium
Calcium
Calcium
Potassium
Potassium
Iron
Iron
Copper
Copper
Zinc
Zinc
Phosphorus
Phosphorus
Sodium
Sodium
Manganese
Manganese
Selenium
Selenium
28%
115%
35%
110%
62%
36%
210%
40%
14%
287%
Vitamin Comparison
Vitamin comparison score is based on the number of vitamins by which one or the other food is richer. The "coverage" charts below show how much of the daily needs can be covered by 300 grams of the food.
1
100 g
300 g
1 fl oz - 30.5g 1 cup - 244g 1 quart - 976g
Vitamin C
Vit. C
Vitamin D
Vit. D
Vitamin A
Vit. A
Vitamin E
Vit. E
Vitamin B1
Vit. B1
Vitamin B2
Vit. B2
Vitamin B3
Vit. B3
Vitamin B5
Vit. B5
Vitamin B6
Vit. B6
Vitamin B12
Vit. B12
Vitamin K
Vit. K
Folate
Folate
0%
18%
19%
0.2%
5%
43%
1.7%
22%
8.5%
59%
0.25%
3.8%
10
100 g
300 g
1 small (2-2/3" x 1/2" x 1/4") - 12g 1 cubic inch - 16g 2 sardines - 24g 1 oz - 28.35g 1 can (3.75 oz) - 92g 1 cup, drained - 149g
Vitamin C
Vit. C
Vitamin D
Vit. D
Vitamin A
Vit. A
Vitamin E
Vit. E
Vitamin B1
Vit. B1
Vitamin B2
Vit. B2
Vitamin B3
Vit. B3
Vitamin B5
Vit. B5
Vitamin B6
Vit. B6
Vitamin B12
Vit. B12
Vitamin K
Vit. K
Folate
Folate
0%
72%
11%
41%
20%
52%
98%
39%
39%
1118%
6.5%
7.5%
All nutrients comparison - raw data values
Nutrient
DV% diff.
Vitamin B12
0.47µg
8.94µg
353%
Selenium
3.3µg
52.7µg
90%
Phosphorus
95mg
490mg
56%
Cholesterol
5mg
142mg
46%
Protein
3.37g
24.62g
43%
Iron
0.03mg
2.92mg
36%
Polyunsaturated fat
0.035g
5.148g
34%
Vitamin B3
0.093mg
5.245mg
32%
Calcium
125mg
382mg
26%
Copper
0.01mg
0.186mg
20%
Vitamin D*
48 IU
193 IU
18%
Vitamin D
1.2µg
4.8µg
18%
Fats
0.97g
11.45g
16%
Vitamin E
0.01mg
2.04mg
14%
Sodium
44mg
307mg
11%
Vitamin B6
0.037mg
0.167mg
10%
Choline
17.7mg
75mg
10%
Monounsaturated fat
0.277g
3.869g
9%
Calories
42kcal
208kcal
8%
Zinc
0.42mg
1.31mg
8%
Magnesium
11mg
39mg
7%
Potassium
150mg
397mg
7%
Vitamin B5
0.361mg
0.642mg
6%
Manganese
0.003mg
0.108mg
5%
Vitamin B1
0.02mg
0.08mg
5%
Saturated fat
0.633g
1.528g
4%
Vitamin A
58µg
32µg
3%
Vitamin B2
0.185mg
0.227mg
3%
Carbs
4.99g
0g
2%
Vitamin K
0.1µg
2.6µg
2%
Folate
5µg
10µg
1%
Protein per 100 calories
8g
12g
N/A
Calories per 10 g protein
125kcal
84kcal
N/A
Weight per 100 calories
238g
48g
N/A
Unsaturated / Saturated Fat ratio
0.49
5.9
N/A
Net carbs
4.99g
0g
N/A
Sugar
5.2g
0g
N/A
Tryptophan
0.043mg
0.276mg
0%
Threonine
0.143mg
1.079mg
0%
Isoleucine
0.174mg
1.134mg
0%
Leucine
0.319mg
2.001mg
0%
Lysine
0.282mg
2.26mg
0%
Methionine
0.088mg
0.729mg
0%
Phenylalanine
0.174mg
0.961mg
0%
Valine
0.22mg
1.268mg
0%
Histidine
0.101mg
0.725mg
0%
Omega-3 - EPA
0g
0.473g
N/A
Omega-3 - DHA
0g
0.509g
N/A
Omega-3 - ALA
0.004g
N/A
Omega-6 - Linoleic acid
0.027g
N/A
Macronutrient Comparison
Macronutrient breakdown side-by-side comparison
2
3%
5%
90%
Protein:
3.37 g
Fats:
0.97 g
Carbs:
4.99 g
Water:
89.92 g
Other:
0.75 g
3
25%
11%
60%
4%
Protein:
24.62 g
Fats:
11.45 g
Carbs:
0 g
Water:
59.61 g
Other:
4.32 g
Contains
more
Carbs Carbs
+∞%
Contains
more
Water Water
+50.8%
Contains
more
Protein Protein
+630.6%
Contains
more
Fats Fats
+1080.4%
Contains
more
Other Other
+476%
Fat Type Comparison
Fat type breakdown side-by-side comparison
1
67%
29%
4%
Saturated fat:
Sat. Fat
0.633 g
Monounsaturated fat:
Mono. Fat
0.277 g
Polyunsaturated fat:
Poly. Fat
0.035 g
2
14%
37%
49%
Saturated fat:
Sat. Fat
1.528 g
Monounsaturated fat:
Mono. Fat
3.869 g
Polyunsaturated fat:
Poly. Fat
5.148 g
Contains
less
Sat. Fat Saturated fat
-58.6%
Contains
more
Mono. Fat Monounsaturated fat
+1296.8%
Contains
more
Poly. Fat Polyunsaturated fat
+14608.6%