Milkshake vs. Malt — In-Depth Nutrition Comparison
Compare
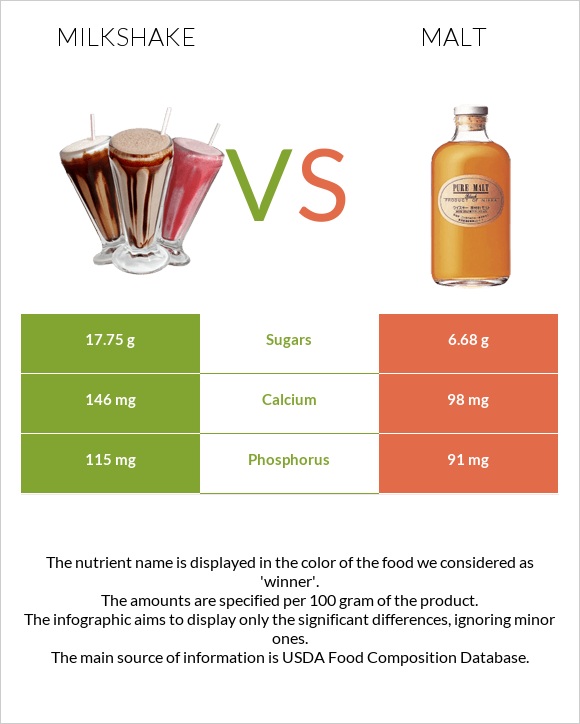
How are milkshake and malt different?
- Malt has more selenium than milkshake.
- Milkshake contains 3 times more sugar than malt. While milkshake contains 17.75g of sugar, malt contains only 6.68g.
- Milkshake has a lower glycemic index (27) than malt (59).
Milk shakes, thick vanilla and Beverages, Malted drink mix, chocolate, powder, prepared with whole milk are the varieties used in this article.
Infographic
Infographic link
Mineral Comparison
Mineral comparison score is based on the number of minerals by which one or the other food is richer. The "coverage" charts below show how much of the daily needs can be covered by 300 grams of the food.
| Contains more CalciumCalcium | +49% |
| Contains more CopperCopper | +37.8% |
| Contains more PhosphorusPhosphorus | +26.4% |
| Contains more MagnesiumMagnesium | +25% |
| Contains more IronIron | +110% |
| Contains less SodiumSodium | -36.8% |
| Contains more ManganeseManganese | +471.4% |
| Contains more SeleniumSelenium | +134.8% |
Vitamin Comparison
Vitamin comparison score is based on the number of vitamins by which one or the other food is richer. The "coverage" charts below show how much of the daily needs can be covered by 300 grams of the food.
| Contains more Vitamin DVitamin D | +∞% |
| Contains more Vitamin B12Vitamin B12 | +23.8% |
| Contains more Vitamin CVitamin C | +∞% |
| Contains more Vitamin EVitamin E | +20% |
| Contains more Vitamin B1Vitamin B1 | +80% |
| Contains more Vitamin B3Vitamin B3 | +77.4% |
| Contains more Vitamin KVitamin K | +50% |
| Contains more FolateFolate | +28.6% |
All nutrients comparison - raw data values
| Nutrient |  |
 |
DV% diff. |
| Vitamin D* | 48 IU | 6% | |
| Vitamin D | 1.2µg | 6% | |
| Selenium | 2.3µg | 5.4µg | 6% |
| Calcium | 146mg | 98mg | 5% |
| Vitamin B12 | 0.52µg | 0.42µg | 4% |
| Phosphorus | 115mg | 91mg | 3% |
| Manganese | 0.014mg | 0.08mg | 3% |
| Choline | 14.3mg | 3% | |
| Carbs | 17.75g | 11.2g | 2% |
| Fiber | 0g | 0.5g | 2% |
| Copper | 0.051mg | 0.037mg | 2% |
| Sodium | 95mg | 60mg | 2% |
| Vitamin B1 | 0.03mg | 0.054mg | 2% |
| Calories | 112kcal | 85kcal | 1% |
| Protein | 3.86g | 3.37g | 1% |
| Cholesterol | 12mg | 10mg | 1% |
| Magnesium | 12mg | 15mg | 1% |
| Iron | 0.1mg | 0.21mg | 1% |
| Vitamin B2 | 0.195mg | 0.184mg | 1% |
| Vitamin B3 | 0.146mg | 0.259mg | 1% |
| Folate | 7µg | 9µg | 1% |
| Polyunsaturated fat | 0.113g | 0.208g | 1% |
| Caffeine | 0mg | 3mg | 1% |
| Protein per 100 calories | 3.4g | 4g | N/A |
| Calories per 10 g protein | 290kcal | 252kcal | N/A |
| Weight per 100 calories | 89g | 118g | N/A |
| Fats | 3.03g | 3.29g | 0% |
| Unsaturated / Saturated Fat ratio | 0.52 | 0.55 | N/A |
| Vitamin C | 0mg | 0.1mg | 0% |
| Net carbs | 17.75g | 10.7g | N/A |
| Potassium | 183mg | 172mg | 0% |
| Sugar | 17.75g | 6.68g | N/A |
| Zinc | 0.39mg | 0.41mg | 0% |
| Vitamin A | 25µg | 26µg | 0% |
| Vitamin E | 0.05mg | 0.06mg | 0% |
| Vitamin B5 | 0.368mg | 0.354mg | 0% |
| Vitamin B6 | 0.042mg | 0.046mg | 0% |
| Vitamin K | 0.2µg | 0.3µg | 0% |
| Saturated fat | 1.886g | 1.883g | 0% |
| Monounsaturated fat | 0.875g | 0.827g | 0% |
| Tryptophan | 0.054mg | 0.074mg | 0% |
| Threonine | 0.174mg | 0.143mg | 0% |
| Isoleucine | 0.234mg | 0.165mg | 0% |
| Leucine | 0.378mg | 0.268mg | 0% |
| Lysine | 0.306mg | 0.142mg | 0% |
| Methionine | 0.097mg | 0.074mg | 0% |
| Phenylalanine | 0.186mg | 0.15mg | 0% |
| Valine | 0.258mg | 0.193mg | 0% |
| Histidine | 0.105mg | 0.077mg | 0% |
Macronutrient Comparison
Macronutrient breakdown side-by-side comparison
| Contains more ProteinProtein | +14.5% |
| Contains more CarbsCarbs | +58.5% |
| Contains more OtherOther | +13.8% |
~equal in
Fats
~3.29g
~equal in
Water
~81.34g
Fat Type Comparison
Fat type breakdown side-by-side comparison
| Contains more Poly. FatPolyunsaturated fat | +84.1% |
~equal in
Saturated fat
~1.883g
~equal in
Monounsaturated fat
~0.827g


