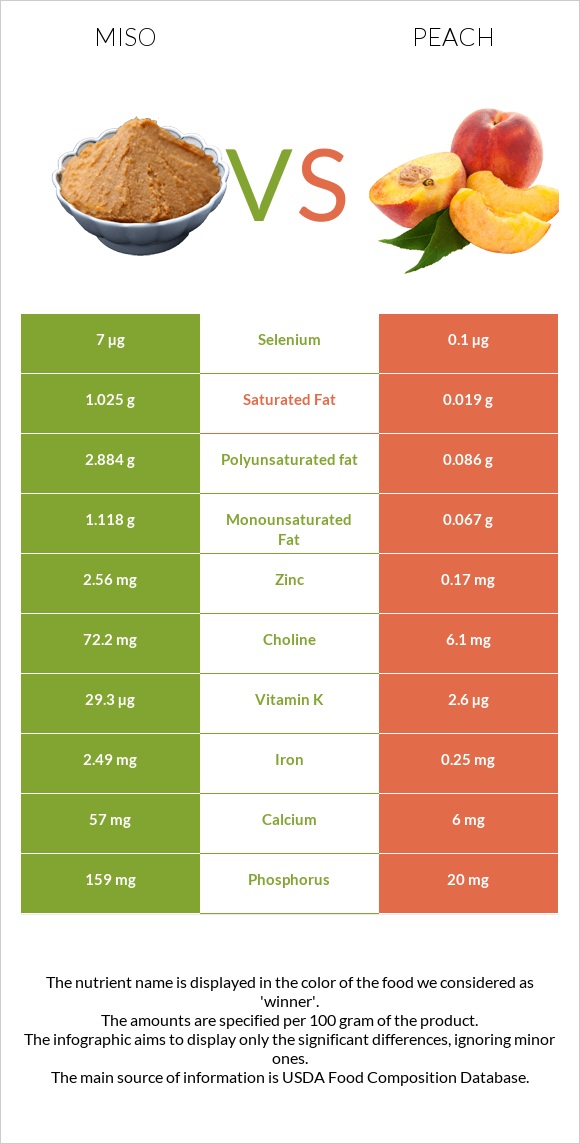
How are miso and peach different? Miso is higher than peach in copper, manganese, iron, vitamin K, zinc, phosphorus, fiber, vitamin B2, and vitamin B6. Miso covers your daily need for sodium, 162% more than peach. Miso contains 15 times more zinc than peach. Miso contains 2.56mg of zinc, while peach contains 0.17mg. Peach is lower in sodium. Miso has a higher glycemic index (61) than peach (42). Miso and Peaches, yellow, raw types were used in this article.
Infographic
Mineral Comparison
Mineral comparison score is based on the number of minerals by which one or the other food is richer. The "coverage" charts below show how much of the daily needs can be covered by 300 grams of the food.
8
100 g
300 g
1 tbsp - 17g 1 cup - 275g
Magnesium
Magnesium
Calcium
Calcium
Potassium
Potassium
Iron
Iron
Copper
Copper
Zinc
Zinc
Phosphorus
Phosphorus
Sodium
Sodium
Manganese
Manganese
Selenium
Selenium
34%
17%
19%
93%
140%
70%
68%
486%
112%
38%
1
100 g
300 g
1 small (2-1/2" dia) - 130g 1 NLEA serving - 147g 1 medium (2-2/3" dia) - 150g 1 cup slices - 154g 1 large (2-3/4" dia) - 175g 1 extra large (3" dia) - 224g
Magnesium
Magnesium
Calcium
Calcium
Potassium
Potassium
Iron
Iron
Copper
Copper
Zinc
Zinc
Phosphorus
Phosphorus
Sodium
Sodium
Manganese
Manganese
Selenium
Selenium
6.4%
1.8%
17%
9.4%
23%
4.6%
8.6%
0%
8%
0.55%
Vitamin Comparison
Vitamin comparison score is based on the number of vitamins by which one or the other food is richer. The "coverage" charts below show how much of the daily needs can be covered by 300 grams of the food.
8
100 g
300 g
1 tbsp - 17g 1 cup - 275g
Vitamin C
Vit. C
Vitamin D
Vit. D
Vitamin A
Vit. A
Vitamin E
Vit. E
Vitamin B1
Vit. B1
Vitamin B2
Vit. B2
Vitamin B3
Vit. B3
Vitamin B5
Vit. B5
Vitamin B6
Vit. B6
Vitamin B12
Vit. B12
Vitamin K
Vit. K
Folate
Folate
0%
0%
1.3%
0.2%
25%
54%
17%
20%
46%
10%
73%
14%
3
100 g
300 g
1 small (2-1/2" dia) - 130g 1 NLEA serving - 147g 1 medium (2-2/3" dia) - 150g 1 cup slices - 154g 1 large (2-3/4" dia) - 175g 1 extra large (3" dia) - 224g
Vitamin C
Vit. C
Vitamin D
Vit. D
Vitamin A
Vit. A
Vitamin E
Vit. E
Vitamin B1
Vit. B1
Vitamin B2
Vit. B2
Vitamin B3
Vit. B3
Vitamin B5
Vit. B5
Vitamin B6
Vit. B6
Vitamin B12
Vit. B12
Vitamin K
Vit. K
Folate
Folate
22%
0%
5.3%
15%
6%
7.2%
15%
9.2%
5.8%
0%
6.5%
3%
All nutrients comparison - raw data values
Nutrient
DV% diff.
Sodium
3728mg
0mg
162%
Copper
0.42mg
0.068mg
39%
Manganese
0.859mg
0.061mg
35%
Iron
2.49mg
0.25mg
28%
Protein
12.79g
0.91g
24%
Zinc
2.56mg
0.17mg
22%
Vitamin K
29.3µg
2.6µg
22%
Phosphorus
159mg
20mg
20%
Polyunsaturated fat
2.884g
0.086g
19%
Fiber
5.4g
1.5g
16%
Vitamin B2
0.233mg
0.031mg
16%
Selenium
7µg
0.1µg
13%
Vitamin B6
0.199mg
0.025mg
13%
Choline
72.2mg
6.1mg
12%
Fats
6.01g
0.25g
9%
Magnesium
48mg
9mg
9%
Calories
198kcal
39kcal
8%
Vitamin C
0mg
6.6mg
7%
Vitamin B1
0.098mg
0.024mg
6%
Fructose
6g
1.53g
6%
Carbs
25.37g
9.54g
5%
Calcium
57mg
6mg
5%
Vitamin E
0.01mg
0.73mg
5%
Saturated fat
1.025g
0.019g
5%
Vitamin B5
0.337mg
0.153mg
4%
Folate
19µg
4µg
4%
Vitamin B12
0.08µg
0µg
3%
Monounsaturated fat
1.118g
0.067g
3%
Potassium
210mg
190mg
1%
Vitamin A
4µg
16µg
1%
Vitamin B3
0.906mg
0.806mg
1%
Protein per 100 calories
6.5g
2.3g
N/A
Calories per 10 g protein
155kcal
429kcal
N/A
Weight per 100 calories
51g
256g
N/A
Unsaturated / Saturated Fat ratio
3.9
8.1
N/A
Net carbs
19.97g
8.04g
N/A
Sugar
6.2g
8.39g
N/A
Tryptophan
0.155mg
0.01mg
0%
Threonine
0.479mg
0.016mg
0%
Isoleucine
0.508mg
0.017mg
0%
Leucine
0.82mg
0.027mg
0%
Lysine
0.478mg
0.03mg
0%
Methionine
0.129mg
0.01mg
0%
Phenylalanine
0.486mg
0.019mg
0%
Valine
0.547mg
0.022mg
0%
Histidine
0.243mg
0.013mg
0%
Macronutrient Comparison
Macronutrient breakdown side-by-side comparison
4
13%
6%
25%
43%
13%
Protein:
12.79 g
Fats:
6.01 g
Carbs:
25.37 g
Water:
43.02 g
Other:
12.81 g
1
10%
89%
Protein:
0.91 g
Fats:
0.25 g
Carbs:
9.54 g
Water:
88.87 g
Other:
0.43 g
Contains
more
Protein Protein
+1305.5%
Contains
more
Fats Fats
+2304%
Contains
more
Carbs Carbs
+165.9%
Contains
more
Other Other
+2879.1%
Contains
more
Water Water
+106.6%
Fat Type Comparison
Fat type breakdown side-by-side comparison
2
20%
22%
57%
Saturated fat:
Sat. Fat
1.025 g
Monounsaturated fat:
Mono. Fat
1.118 g
Polyunsaturated fat:
Poly. Fat
2.884 g
1
11%
39%
50%
Saturated fat:
Sat. Fat
0.019 g
Monounsaturated fat:
Mono. Fat
0.067 g
Polyunsaturated fat:
Poly. Fat
0.086 g
Contains
more
Mono. Fat Monounsaturated fat
+1568.7%
Contains
more
Poly. Fat Polyunsaturated fat
+3253.5%
Contains
less
Sat. Fat Saturated fat
-98.1%
Carbohydrate type comparison
Carbohydrate type breakdown side-by-side comparison
2
97%
3%
Starch:
0 g
Sucrose:
0 g
Glucose:
0 g
Fructose:
6 g
Lactose:
0 g
Maltose:
0.2 g
Galactose:
0 g
3
57%
23%
18%
Starch:
0 g
Sucrose:
4.76 g
Glucose:
1.95 g
Fructose:
1.53 g
Lactose:
0 g
Maltose:
0.08 g
Galactose:
0.06 g
Contains
more
Fructose Fructose
+292.2%
Contains
more
Maltose Maltose
+150%
Contains
more
Sucrose Sucrose
+∞%
Contains
more
Glucose Glucose
+∞%
Contains
more
Galactose Galactose
+∞%
~equal in
Starch
~0g
~equal in
Lactose
~0g