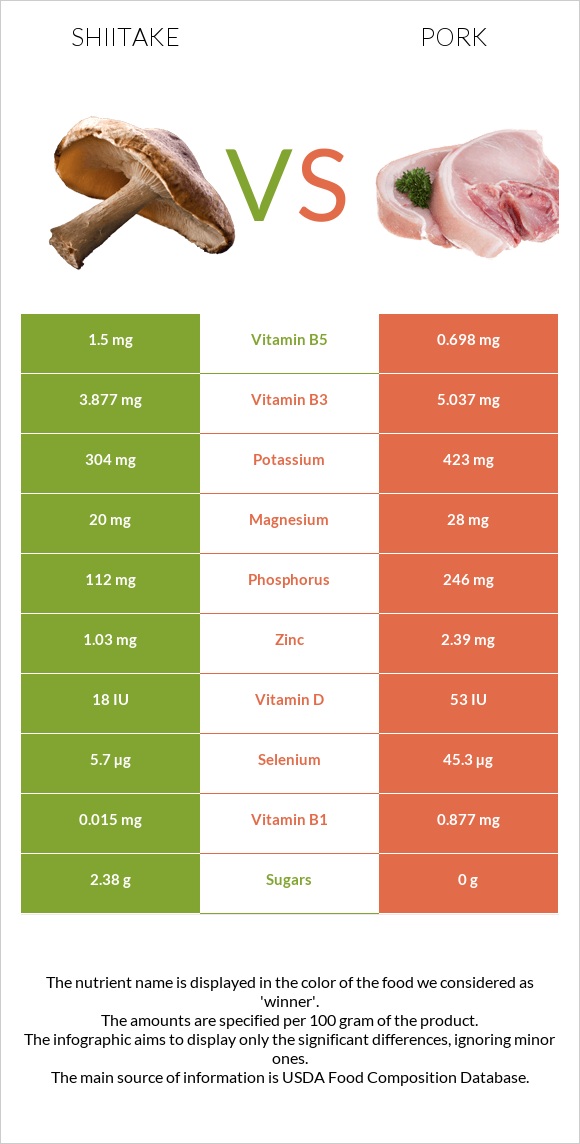
Significant differences between shiitake and pork Shiitake has more vitamin B5, fiber, manganese, and copper; however, pork is richer in selenium, vitamin B1, phosphorus, vitamin B6, zinc, and vitamin B2. Pork covers your daily selenium needs 72% more than shiitake. Shiitake has a higher glycemic index. The glycemic index of shiitake is 32, while the glycemic index of pork is 0. Specific food types used in this comparison are Mushrooms, shiitake, raw and Pork, fresh, loin, whole, separable lean, and fat, cooked, broiled .
Infographic
Mineral Comparison
Mineral comparison score is based on the number of minerals by which one or the other food is richer. The "coverage" charts below show how much of the daily needs can be covered by 300 grams of the food.
3
100 g
300 g
1 piece whole - 19g
Magnesium
Magnesium
Calcium
Calcium
Potassium
Potassium
Iron
Iron
Copper
Copper
Zinc
Zinc
Phosphorus
Phosphorus
Sodium
Sodium
Manganese
Manganese
Selenium
Selenium
14%
0.6%
27%
15%
47%
28%
48%
1.2%
30%
31%
7
100 g
300 g
3 oz - 85g 1 chop, excluding refuse (yield from 1 raw chop, with refuse, weighing 151 g) - 87g
Magnesium
Magnesium
Calcium
Calcium
Potassium
Potassium
Iron
Iron
Copper
Copper
Zinc
Zinc
Phosphorus
Phosphorus
Sodium
Sodium
Manganese
Manganese
Selenium
Selenium
20%
5.7%
37%
33%
24%
65%
105%
8.1%
1.2%
247%
Vitamin Comparison
Vitamin comparison score is based on the number of vitamins by which one or the other food is richer. The "coverage" charts below show how much of the daily needs can be covered by 300 grams of the food.
2
100 g
300 g
1 piece whole - 19g
Vitamin C
Vit. C
Vitamin D
Vit. D
Vitamin A
Vit. A
Vitamin E
Vit. E
Vitamin B1
Vit. B1
Vitamin B2
Vit. B2
Vitamin B3
Vit. B3
Vitamin B5
Vit. B5
Vitamin B6
Vit. B6
Vitamin B12
Vit. B12
Vitamin K
Vit. K
Folate
Folate
0%
6%
0%
0%
3.8%
50%
73%
90%
68%
0%
0%
9.8%
9
100 g
300 g
3 oz - 85g 1 chop, excluding refuse (yield from 1 raw chop, with refuse, weighing 151 g) - 87g
Vitamin C
Vit. C
Vitamin D
Vit. D
Vitamin A
Vit. A
Vitamin E
Vit. E
Vitamin B1
Vit. B1
Vitamin B2
Vit. B2
Vitamin B3
Vit. B3
Vitamin B5
Vit. B5
Vitamin B6
Vit. B6
Vitamin B12
Vit. B12
Vitamin K
Vit. K
Folate
Folate
2%
20%
0.67%
5.8%
219%
74%
94%
42%
107%
88%
0%
3.8%
All nutrients comparison - raw data values
Nutrient
DV% diff.
Selenium
5.7µg
45.3µg
72%
Vitamin B1
0.015mg
0.877mg
72%
Protein
2.24g
27.32g
50%
Vitamin B12
0.7µg
29%
Cholesterol
80mg
27%
Saturated fat
5.23g
24%
Fats
0.49g
13.92g
21%
Phosphorus
112mg
246mg
19%
Choline
93.9mg
17%
Vitamin B5
1.5mg
0.698mg
16%
Monounsaturated fat
6.19g
15%
Vitamin B6
0.293mg
0.464mg
13%
Zinc
1.03mg
2.39mg
12%
Calories
34kcal
242kcal
10%
Fiber
2.5g
0g
10%
Manganese
0.23mg
0.009mg
10%
Copper
0.142mg
0.073mg
8%
Vitamin B2
0.217mg
0.321mg
8%
Polyunsaturated fat
1.2g
8%
Vitamin B3
3.877mg
5.037mg
7%
Iron
0.41mg
0.87mg
6%
Vitamin D
0.4µg
1.3µg
5%
Vitamin D*
18 IU
53 IU
4%
Potassium
304mg
423mg
4%
Carbs
6.79g
0g
2%
Magnesium
20mg
28mg
2%
Calcium
2mg
19mg
2%
Sodium
9mg
62mg
2%
Vitamin E
0.29mg
2%
Folate
13µg
5µg
2%
Vitamin C
0.6mg
1%
Protein per 100 calories
6.6g
11g
N/A
Calories per 10 g protein
152kcal
89kcal
N/A
Weight per 100 calories
294g
41g
N/A
Unsaturated / Saturated Fat ratio
1.4
N/A
Net carbs
4.29g
0g
N/A
Sugar
2.38g
0g
N/A
Vitamin A
2µg
0%
Tryptophan
0.011mg
0.338mg
0%
Threonine
0.134mg
1.234mg
0%
Isoleucine
0.111mg
1.26mg
0%
Leucine
0.189mg
2.177mg
0%
Lysine
0.134mg
2.446mg
0%
Methionine
0.033mg
0.712mg
0%
Phenylalanine
0.111mg
1.086mg
0%
Valine
0.145mg
1.473mg
0%
Histidine
0.056mg
1.067mg
0%
Macronutrient Comparison
Macronutrient breakdown side-by-side comparison
2
2%
7%
90%
Protein:
2.24 g
Fats:
0.49 g
Carbs:
6.79 g
Water:
89.74 g
Other:
0.74 g
3
27%
14%
58%
Protein:
27.32 g
Fats:
13.92 g
Carbs:
0 g
Water:
57.87 g
Other:
0.89 g
Contains
more
Carbs Carbs
+∞%
Contains
more
Water Water
+55.1%
Contains
more
Protein Protein
+1119.6%
Contains
more
Fats Fats
+2740.8%
Contains
more
Other Other
+20.3%