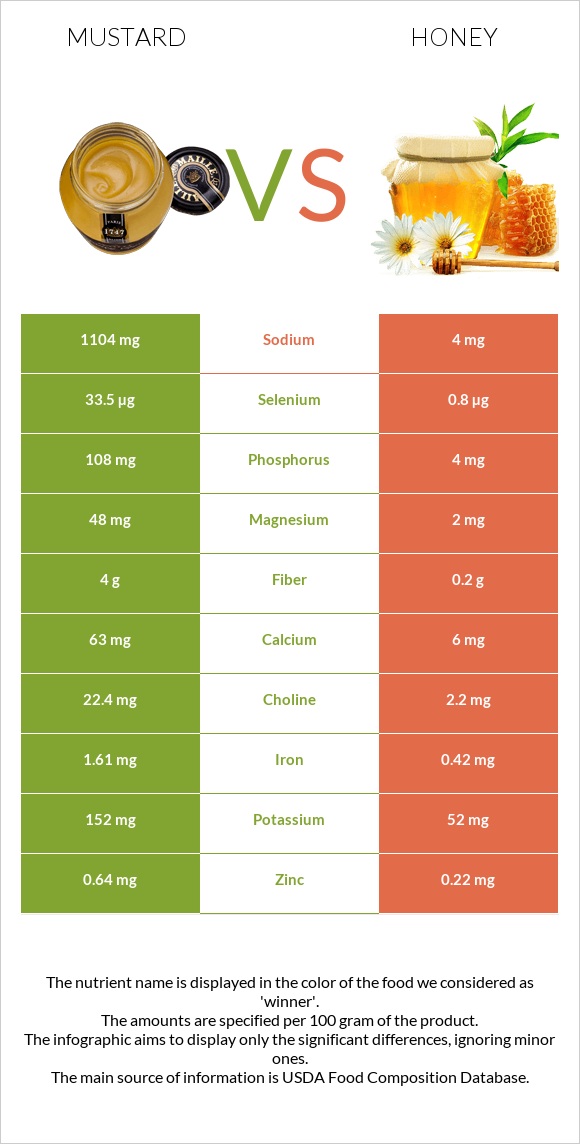
Important differences between mustard and honey Honey has less selenium, fiber, iron, manganese, phosphorus, vitamin B1, magnesium, and calcium. Mustard's daily need coverage for selenium is 59% more. Honey is lower in sodium. Honey has a higher glycemic index than mustard. The food varieties used in the comparison are Mustard, prepared, yellow and Honey .
Infographic
Mineral Comparison
Mineral comparison score is based on the number of minerals by which one or the other food is richer. The "coverage" charts below show how much of the daily needs can be covered by 300 grams of the food.
9
100 g
300 g
1 tsp or 1 packet - 5g 1 cup - 249g
Magnesium
Magnesium
Calcium
Calcium
Potassium
Potassium
Iron
Iron
Copper
Copper
Zinc
Zinc
Phosphorus
Phosphorus
Sodium
Sodium
Manganese
Manganese
Selenium
Selenium
34%
19%
13%
60%
25%
17%
46%
144%
55%
183%
1
100 g
300 g
1 packet (0.5 oz) - 14g 1 tbsp - 21g 1 cup - 339g
Magnesium
Magnesium
Calcium
Calcium
Potassium
Potassium
Iron
Iron
Copper
Copper
Zinc
Zinc
Phosphorus
Phosphorus
Sodium
Sodium
Manganese
Manganese
Selenium
Selenium
1.4%
1.8%
4.6%
16%
12%
6%
1.7%
0.52%
10%
4.4%
Vitamin Comparison
Vitamin comparison score is based on the number of vitamins by which one or the other food is richer. The "coverage" charts below show how much of the daily needs can be covered by 300 grams of the food.
9
100 g
300 g
1 tsp or 1 packet - 5g 1 cup - 249g
Vitamin C
Vit. C
Vitamin D
Vit. D
Vitamin A
Vit. A
Vitamin E
Vit. E
Vitamin B1
Vit. B1
Vitamin B2
Vit. B2
Vitamin B3
Vit. B3
Vitamin B5
Vit. B5
Vitamin B6
Vit. B6
Vitamin B12
Vit. B12
Vitamin K
Vit. K
Folate
Folate
1%
0%
1.7%
7.2%
44%
16%
11%
15%
16%
0%
3.5%
5.3%
1
100 g
300 g
1 packet (0.5 oz) - 14g 1 tbsp - 21g 1 cup - 339g
Vitamin C
Vit. C
Vitamin D
Vit. D
Vitamin A
Vit. A
Vitamin E
Vit. E
Vitamin B1
Vit. B1
Vitamin B2
Vit. B2
Vitamin B3
Vit. B3
Vitamin B5
Vit. B5
Vitamin B6
Vit. B6
Vitamin B12
Vit. B12
Vitamin K
Vit. K
Folate
Folate
1.7%
0%
0%
0%
0%
8.8%
2.3%
4.1%
5.5%
0%
0%
1.5%
All nutrients comparison - raw data values
Nutrient
DV% diff.
Selenium
33.5µg
0.8µg
59%
Fructose
0.23g
40.94g
51%
Sodium
1104mg
4mg
48%
Carbs
5.83g
82.4g
26%
Iron
1.61mg
0.42mg
15%
Fiber
4g
0.2g
15%
Phosphorus
108mg
4mg
15%
Manganese
0.422mg
0.08mg
15%
Vitamin B1
0.177mg
0mg
15%
Calories
60kcal
304kcal
12%
Magnesium
48mg
2mg
11%
Protein
3.74g
0.3g
7%
Calcium
63mg
6mg
6%
Fats
3.34g
0g
5%
Monounsaturated fat
2.182g
0g
5%
Polyunsaturated fat
0.774g
0g
5%
Copper
0.074mg
0.036mg
4%
Zinc
0.64mg
0.22mg
4%
Vitamin B5
0.254mg
0.068mg
4%
Vitamin B6
0.07mg
0.024mg
4%
Choline
22.4mg
2.2mg
4%
Potassium
152mg
52mg
3%
Vitamin B3
0.565mg
0.121mg
3%
Vitamin E
0.36mg
0mg
2%
Vitamin B2
0.07mg
0.038mg
2%
Vitamin A
5µg
0µg
1%
Vitamin K
1.4µg
0µg
1%
Folate
7µg
2µg
1%
Saturated fat
0.214g
0g
1%
Protein per 100 calories
6.2g
0.1g
N/A
Calories per 10 g protein
160kcal
10133kcal
N/A
Weight per 100 calories
167g
33g
N/A
Unsaturated / Saturated Fat ratio
14
N/A
Vitamin C
0.3mg
0.5mg
0%
Net carbs
1.83g
82.2g
N/A
Sugar
0.92g
82.12g
N/A
Starch
0.64g
0%
Trans fat
0.009g
N/A
Tryptophan
0.009mg
0.004mg
0%
Threonine
0.167mg
0.004mg
0%
Isoleucine
0.146mg
0.008mg
0%
Leucine
0.292mg
0.01mg
0%
Lysine
0.264mg
0.008mg
0%
Methionine
0.076mg
0.001mg
0%
Phenylalanine
0.161mg
0.011mg
0%
Valine
0.189mg
0.009mg
0%
Histidine
0.119mg
0.001mg
0%
Omega-3 - ALA
0.373g
N/A
Omega-3 - Eicosatrienoic acid
0.018g
N/A
Omega-6 - Eicosadienoic acid
0.01g
N/A
Omega-6 - Linoleic acid
0.358g
N/A
Macronutrient Comparison
Macronutrient breakdown side-by-side comparison
4
4%
3%
6%
84%
3%
Protein:
3.74 g
Fats:
3.34 g
Carbs:
5.83 g
Water:
83.72 g
Other:
3.37 g
1
82%
17%
Protein:
0.3 g
Fats:
0 g
Carbs:
82.4 g
Water:
17.1 g
Other:
0.2 g
Contains
more
Protein Protein
+1146.7%
Contains
more
Fats Fats
+∞%
Contains
more
Water Water
+389.6%
Contains
more
Other Other
+1585%
Contains
more
Carbs Carbs
+1313.4%
Carbohydrate type comparison
Carbohydrate type breakdown side-by-side comparison
1
41%
14%
30%
15%
Starch:
0.64 g
Sucrose:
0.21 g
Glucose:
0.47 g
Fructose:
0.23 g
Lactose:
0 g
Maltose:
0 g
Galactose:
0 g
5
44%
50%
2%
4%
Starch:
0 g
Sucrose:
0.89 g
Glucose:
35.75 g
Fructose:
40.94 g
Lactose:
0 g
Maltose:
1.44 g
Galactose:
3.1 g
Contains
more
Starch Starch
+∞%
Contains
more
Sucrose Sucrose
+323.8%
Contains
more
Glucose Glucose
+7506.4%
Contains
more
Fructose Fructose
+17700%
Contains
more
Maltose Maltose
+∞%
Contains
more
Galactose Galactose
+∞%