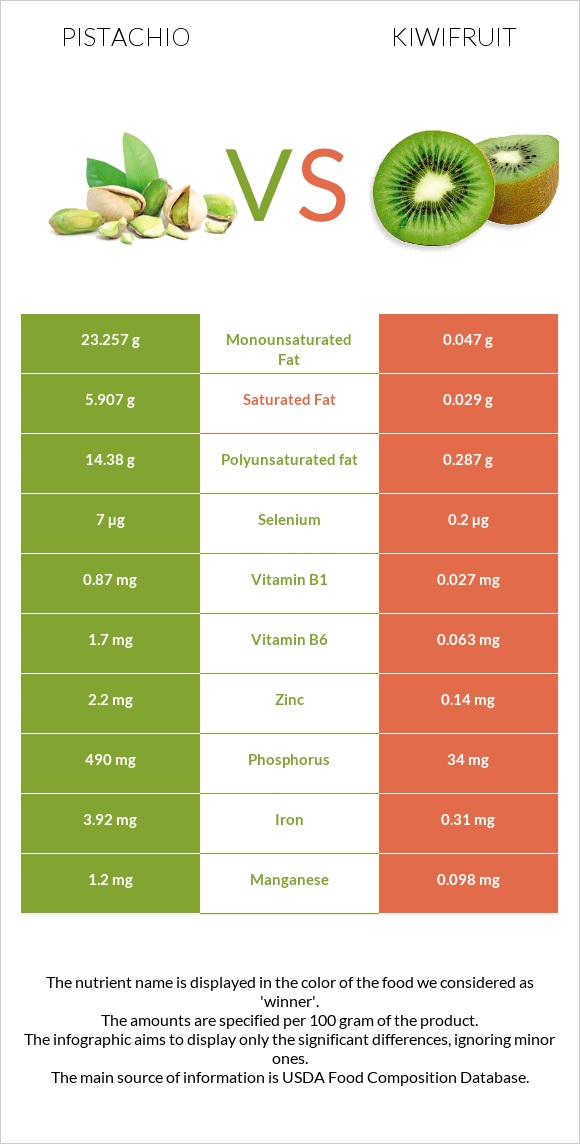
How are pistachios and kiwi different? Pistachios are higher in copper, vitamin B6, vitamin B1, phosphorus, manganese, iron, fiber, and magnesium; however, kiwi is richer in vitamin C. Daily need coverage for copper for pistachios is 130% higher. Pistachios contain 204 times more saturated fat than kiwi. While pistachios contain 5.907g of saturated fat, kiwi contains only 0.029g. Pistachios have a lower glycemic index (28) than kiwi (58). Nuts, pistachio nuts, raw and Kiwifruit, green, raw are the varieties used in this article.
Infographic
Mineral Comparison
Mineral comparison score is based on the number of minerals by which one or the other food is richer. The "coverage" charts below show how much of the daily needs can be covered by 300 grams of the food.
10
100 g
300 g
1 kernel - 0.7g 1 oz (49 kernels) - 28.35g 1 cup - 123g
Magnesium
Magnesium
Calcium
Calcium
Potassium
Potassium
Iron
Iron
Copper
Copper
Zinc
Zinc
Phosphorus
Phosphorus
Sodium
Sodium
Manganese
Manganese
Selenium
Selenium
86%
32%
90%
147%
433%
60%
210%
0.13%
157%
38%
0
100 g
300 g
1 fruit (2" dia) - 69g 1 NLEA serving - 148g 1 cup, sliced - 180g
Magnesium
Magnesium
Calcium
Calcium
Potassium
Potassium
Iron
Iron
Copper
Copper
Zinc
Zinc
Phosphorus
Phosphorus
Sodium
Sodium
Manganese
Manganese
Selenium
Selenium
12%
10%
28%
12%
43%
3.8%
15%
0.39%
13%
1.1%
Vitamin Comparison
Vitamin comparison score is based on the number of vitamins by which one or the other food is richer. The "coverage" charts below show how much of the daily needs can be covered by 300 grams of the food.
8
100 g
300 g
1 kernel - 0.7g 1 oz (49 kernels) - 28.35g 1 cup - 123g
Vitamin C
Vit. C
Vitamin D
Vit. D
Vitamin A
Vit. A
Vitamin E
Vit. E
Vitamin B1
Vit. B1
Vitamin B2
Vit. B2
Vitamin B3
Vit. B3
Vitamin B5
Vit. B5
Vitamin B6
Vit. B6
Vitamin B12
Vit. B12
Vitamin K
Vit. K
Folate
Folate
19%
0%
8.7%
57%
218%
37%
24%
31%
392%
0%
0%
38%
2
100 g
300 g
1 fruit (2" dia) - 69g 1 NLEA serving - 148g 1 cup, sliced - 180g
Vitamin C
Vit. C
Vitamin D
Vit. D
Vitamin A
Vit. A
Vitamin E
Vit. E
Vitamin B1
Vit. B1
Vitamin B2
Vit. B2
Vitamin B3
Vit. B3
Vitamin B5
Vit. B5
Vitamin B6
Vit. B6
Vitamin B12
Vit. B12
Vitamin K
Vit. K
Folate
Folate
309%
0%
1.3%
29%
6.8%
5.8%
6.4%
11%
15%
0%
101%
19%
All nutrients comparison - raw data values
Nutrient
DV% diff.
Copper
1.3mg
0.13mg
130%
Vitamin B6
1.7mg
0.063mg
126%
Vitamin C
5.6mg
92.7mg
97%
Polyunsaturated fat
14.38g
0.287g
94%
Vitamin B1
0.87mg
0.027mg
70%
Fats
45.32g
0.52g
69%
Phosphorus
490mg
34mg
65%
Monounsaturated fat
23.257g
0.047g
58%
Manganese
1.2mg
0.098mg
48%
Iron
3.92mg
0.31mg
45%
Protein
20.16g
1.14g
38%
Vitamin K
40.3µg
34%
Fiber
10.6g
3g
30%
Saturated fat
5.907g
0.029g
27%
Calories
560kcal
61kcal
25%
Magnesium
121mg
17mg
25%
Potassium
1025mg
312mg
21%
Zinc
2.2mg
0.14mg
19%
Selenium
7µg
0.2µg
12%
Vitamin B2
0.16mg
0.025mg
10%
Vitamin E
2.86mg
1.46mg
9%
Calcium
105mg
34mg
7%
Vitamin B5
0.52mg
0.183mg
7%
Folate
51µg
25µg
7%
Vitamin B3
1.3mg
0.341mg
6%
Fructose
0.24g
4.35g
5%
Carbs
27.17g
14.66g
4%
Vitamin A
26µg
4µg
2%
Starch
1.67g
0g
1%
Choline
7.8mg
1%
Protein per 100 calories
3.6g
1.9g
N/A
Calories per 10 g protein
278kcal
535kcal
N/A
Weight per 100 calories
18g
164g
N/A
Unsaturated / Saturated Fat ratio
6.4
12
N/A
Net carbs
16.57g
11.66g
N/A
Sugar
7.66g
8.99g
N/A
Sodium
1mg
3mg
0%
Tryptophan
0.251mg
0.015mg
0%
Threonine
0.684mg
0.047mg
0%
Isoleucine
0.917mg
0.051mg
0%
Leucine
1.604mg
0.066mg
0%
Lysine
1.138mg
0.061mg
0%
Methionine
0.36mg
0.024mg
0%
Phenylalanine
1.092mg
0.044mg
0%
Valine
1.249mg
0.057mg
0%
Histidine
0.512mg
0.027mg
0%
Omega-6 - Linoleic acid
14.091g
N/A
Macronutrient Comparison
Macronutrient breakdown side-by-side comparison
4
20%
45%
27%
4%
3%
Protein:
20.16 g
Fats:
45.32 g
Carbs:
27.17 g
Water:
4.37 g
Other:
2.98 g
1
15%
83%
Protein:
1.14 g
Fats:
0.52 g
Carbs:
14.66 g
Water:
83.07 g
Other:
0.61 g
Contains
more
Protein Protein
+1668.4%
Contains
more
Fats Fats
+8615.4%
Contains
more
Carbs Carbs
+85.3%
Contains
more
Other Other
+388.5%
Contains
more
Water Water
+1800.9%
Fat Type Comparison
Fat type breakdown side-by-side comparison
2
14%
53%
33%
Saturated fat:
Sat. Fat
5.907 g
Monounsaturated fat:
Mono. Fat
23.257 g
Polyunsaturated fat:
Poly. Fat
14.38 g
1
8%
13%
79%
Saturated fat:
Sat. Fat
0.029 g
Monounsaturated fat:
Mono. Fat
0.047 g
Polyunsaturated fat:
Poly. Fat
0.287 g
Contains
more
Mono. Fat Monounsaturated fat
+49383%
Contains
more
Poly. Fat Polyunsaturated fat
+4910.5%
Contains
less
Sat. Fat Saturated fat
-99.5%
Carbohydrate type comparison
Carbohydrate type breakdown side-by-side comparison
2
18%
74%
3%
3%
2%
Starch:
1.67 g
Sucrose:
6.87 g
Glucose:
0.32 g
Fructose:
0.24 g
Lactose:
0 g
Maltose:
0.17 g
Galactose:
0 g
4
2%
46%
48%
2%
2%
Starch:
0 g
Sucrose:
0.15 g
Glucose:
4.11 g
Fructose:
4.35 g
Lactose:
0 g
Maltose:
0.19 g
Galactose:
0.17 g
Contains
more
Starch Starch
+∞%
Contains
more
Sucrose Sucrose
+4480%
Contains
more
Glucose Glucose
+1184.4%
Contains
more
Fructose Fructose
+1712.5%
Contains
more
Maltose Maltose
+11.8%
Contains
more
Galactose Galactose
+∞%