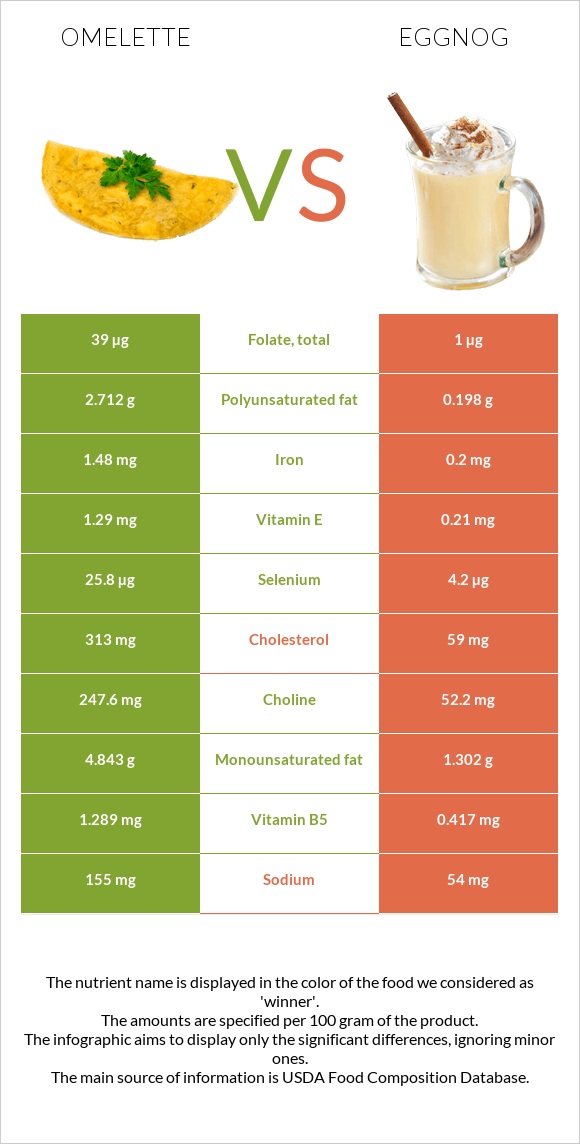
What are the differences between omelette and eggnog? Omelette is richer than eggnog in selenium, choline, vitamin B5, iron, vitamin B2, vitamin B12, folate, phosphorus, and vitamin A. Omelette's daily need coverage for cholesterol is 85% more. Omelette has 39 times more folate than eggnog. While omelette has 39µg of folate, eggnog has only 1µg. The amount of cholesterol in eggnog is lower. The glycemic index of omelette is lower. We used Egg, whole, cooked, omelet and Eggnog types in this article.
Infographic
Mineral Comparison
Mineral comparison score is based on the number of minerals by which one or the other food is richer. The "coverage" charts below show how much of the daily needs can be covered by 300 grams of the food.
6
100 g
300 g
1 tbsp - 15g 1 large - 61g
Magnesium
Magnesium
Calcium
Calcium
Potassium
Potassium
Iron
Iron
Copper
Copper
Zinc
Zinc
Phosphorus
Phosphorus
Sodium
Sodium
Manganese
Manganese
Selenium
Selenium
7.9%
14%
10%
56%
21%
30%
72%
20%
3.1%
141%
4
100 g
300 g
1 fl oz - 31.8g 1 cup - 254g 1 quart - 1016g
Magnesium
Magnesium
Calcium
Calcium
Potassium
Potassium
Iron
Iron
Copper
Copper
Zinc
Zinc
Phosphorus
Phosphorus
Sodium
Sodium
Manganese
Manganese
Selenium
Selenium
14%
39%
15%
7.5%
4.3%
13%
47%
7%
0.65%
23%
Vitamin Comparison
Vitamin comparison score is based on the number of vitamins by which one or the other food is richer. The "coverage" charts below show how much of the daily needs can be covered by 300 grams of the food.
9
100 g
300 g
1 tbsp - 15g 1 large - 61g
Vitamin C
Vit. C
Vitamin D
Vit. D
Vitamin A
Vit. A
Vitamin E
Vit. E
Vitamin B1
Vit. B1
Vitamin B2
Vit. B2
Vitamin B3
Vit. B3
Vitamin B5
Vit. B5
Vitamin B6
Vit. B6
Vitamin B12
Vit. B12
Vitamin K
Vit. K
Folate
Folate
0%
26%
57%
26%
8.5%
89%
1.2%
77%
33%
95%
11%
29%
2
100 g
300 g
1 fl oz - 31.8g 1 cup - 254g 1 quart - 1016g
Vitamin C
Vit. C
Vitamin D
Vit. D
Vitamin A
Vit. A
Vitamin E
Vit. E
Vitamin B1
Vit. B1
Vitamin B2
Vit. B2
Vitamin B3
Vit. B3
Vitamin B5
Vit. B5
Vitamin B6
Vit. B6
Vitamin B12
Vit. B12
Vitamin K
Vit. K
Folate
Folate
5%
18%
20%
4.2%
8.5%
44%
2%
25%
12%
56%
0.75%
0.75%
All nutrients comparison - raw data values
Nutrient
DV% diff.
Cholesterol
313mg
59mg
85%
Selenium
25.8µg
4.2µg
39%
Choline
247.6mg
52.2mg
36%
Vitamin B5
1.289mg
0.417mg
17%
Polyunsaturated fat
2.712g
0.198g
17%
Iron
1.48mg
0.2mg
16%
Vitamin B2
0.386mg
0.19mg
15%
Vitamin A
172µg
59µg
13%
Vitamin B12
0.76µg
0.45µg
13%
Protein
10.57g
4.55g
12%
Fats
11.66g
4.19g
11%
Folate
39µg
1µg
10%
Monounsaturated fat
4.843g
1.302g
9%
Calcium
48mg
130mg
8%
Phosphorus
167mg
109mg
8%
Vitamin E
1.29mg
0.21mg
7%
Vitamin B6
0.143mg
0.05mg
7%
Copper
0.063mg
0.013mg
6%
Zinc
1.09mg
0.46mg
6%
Sodium
155mg
54mg
4%
Vitamin K
4.5µg
0.3µg
4%
Calories
154kcal
88kcal
3%
Vitamin D*
69 IU
49 IU
3%
Vitamin D
1.7µg
1.2µg
3%
Saturated fat
3.319g
2.591g
3%
Vitamin C
0mg
1.5mg
2%
Carbs
0.64g
8.05g
2%
Magnesium
11mg
19mg
2%
Potassium
117mg
165mg
1%
Manganese
0.024mg
0.005mg
1%
Protein per 100 calories
6.9g
5.2g
N/A
Calories per 10 g protein
146kcal
193kcal
N/A
Weight per 100 calories
65g
114g
N/A
Unsaturated / Saturated Fat ratio
2.3
0.58
N/A
Net carbs
0.64g
8.05g
N/A
Sugar
0.31g
8.05g
N/A
Vitamin B1
0.034mg
0.034mg
0%
Vitamin B3
0.064mg
0.105mg
0%
Trans fat
0.709g
N/A
Tryptophan
0.14mg
0.085mg
0%
Threonine
0.467mg
0.201mg
0%
Isoleucine
0.565mg
0.237mg
0%
Leucine
0.913mg
0.383mg
0%
Lysine
0.767mg
0.257mg
0%
Methionine
0.319mg
0.12mg
0%
Phenylalanine
0.572mg
0.225mg
0%
Valine
0.722mg
0.289mg
0%
Histidine
0.26mg
0.108mg
0%
Fructose
0g
0.04g
0%
Omega-3 - DHA
0.049g
0g
N/A
Omega-3 - DPA
0.006g
0g
N/A
Omega-6 - Eicosadienoic acid
0.015g
N/A
Macronutrient Comparison
Macronutrient breakdown side-by-side comparison
3
11%
12%
76%
Protein:
10.57 g
Fats:
11.66 g
Carbs:
0.64 g
Water:
76.13 g
Other:
1 g
2
5%
4%
8%
83%
Protein:
4.55 g
Fats:
4.19 g
Carbs:
8.05 g
Water:
82.54 g
Other:
0.67 g
Contains
more
Protein Protein
+132.3%
Contains
more
Fats Fats
+178.3%
Contains
more
Other Other
+49.3%
Contains
more
Carbs Carbs
+1157.8%
Fat Type Comparison
Fat type breakdown side-by-side comparison
2
31%
45%
25%
Saturated fat:
Sat. Fat
3.319 g
Monounsaturated fat:
Mono. Fat
4.843 g
Polyunsaturated fat:
Poly. Fat
2.712 g
1
63%
32%
5%
Saturated fat:
Sat. Fat
2.591 g
Monounsaturated fat:
Mono. Fat
1.302 g
Polyunsaturated fat:
Poly. Fat
0.198 g
Contains
more
Mono. Fat Monounsaturated fat
+272%
Contains
more
Poly. Fat Polyunsaturated fat
+1269.7%
Contains
less
Sat. Fat Saturated fat
-21.9%
Carbohydrate type comparison
Carbohydrate type breakdown side-by-side comparison
1
100%
Starch:
0 g
Sucrose:
0 g
Glucose:
0.31 g
Fructose:
0 g
Lactose:
0 g
Maltose:
0 g
Galactose:
0 g
5
97%
Starch:
0 g
Sucrose:
0.04 g
Glucose:
0.07 g
Fructose:
0.04 g
Lactose:
7.84 g
Maltose:
0.04 g
Galactose:
0.04 g
Contains
more
Glucose Glucose
+342.9%
Contains
more
Sucrose Sucrose
+∞%
Contains
more
Fructose Fructose
+∞%
Contains
more
Lactose Lactose
+∞%
Contains
more
Maltose Maltose
+∞%
Contains
more
Galactose Galactose
+∞%