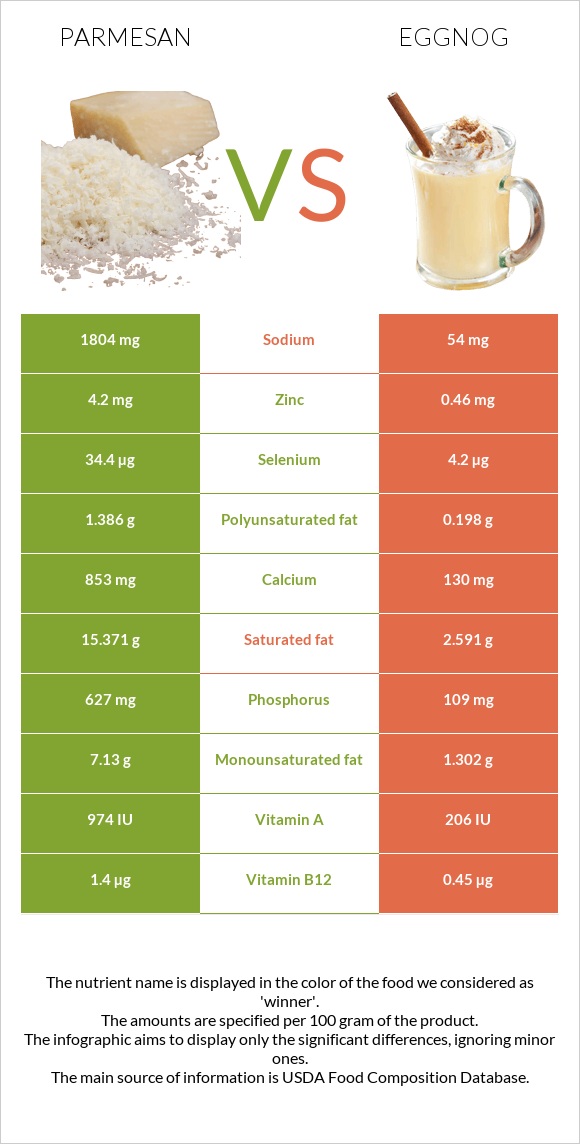
How are parmesan and eggnog different? Parmesan has more phosphorus, calcium, selenium, vitamin B12, zinc, vitamin A, and vitamin B2 than eggnog. Daily need coverage for sodium for parmesan is 76% higher. Parmesan contains 9 times more zinc than eggnog. While parmesan contains 4.2mg of zinc, eggnog contains only 0.46mg. Eggnog has less sodium. Cheese, parmesan, grated and Eggnog are the varieties used in this article.
Infographic
Mineral Comparison
Mineral comparison score is based on the number of minerals by which one or the other food is richer. The "coverage" charts below show how much of the daily needs can be covered by 300 grams of the food.
8
100 g
300 g
1 tbsp - 5g 1 oz - 28.35g
Magnesium
Magnesium
Calcium
Calcium
Potassium
Potassium
Iron
Iron
Copper
Copper
Zinc
Zinc
Phosphorus
Phosphorus
Sodium
Sodium
Manganese
Manganese
Selenium
Selenium
24%
256%
16%
18%
13%
115%
269%
235%
9.3%
188%
1
100 g
300 g
1 fl oz - 31.8g 1 cup - 254g 1 quart - 1016g
Magnesium
Magnesium
Calcium
Calcium
Potassium
Potassium
Iron
Iron
Copper
Copper
Zinc
Zinc
Phosphorus
Phosphorus
Sodium
Sodium
Manganese
Manganese
Selenium
Selenium
14%
39%
15%
7.5%
4.3%
13%
47%
7%
0.65%
23%
Vitamin Comparison
Vitamin comparison score is based on the number of vitamins by which one or the other food is richer. The "coverage" charts below show how much of the daily needs can be covered by 300 grams of the food.
7
100 g
300 g
1 tbsp - 5g 1 oz - 28.35g
Vitamin C
Vit. C
Vitamin D
Vit. D
Vitamin A
Vit. A
Vitamin E
Vit. E
Vitamin B1
Vit. B1
Vitamin B2
Vit. B2
Vitamin B3
Vit. B3
Vitamin B5
Vit. B5
Vitamin B6
Vit. B6
Vitamin B12
Vit. B12
Vitamin K
Vit. K
Folate
Folate
0%
7.5%
87%
11%
6.5%
83%
1.5%
27%
19%
175%
4.3%
4.5%
4
100 g
300 g
1 fl oz - 31.8g 1 cup - 254g 1 quart - 1016g
Vitamin C
Vit. C
Vitamin D
Vit. D
Vitamin A
Vit. A
Vitamin E
Vit. E
Vitamin B1
Vit. B1
Vitamin B2
Vit. B2
Vitamin B3
Vit. B3
Vitamin B5
Vit. B5
Vitamin B6
Vit. B6
Vitamin B12
Vit. B12
Vitamin K
Vit. K
Folate
Folate
5%
18%
20%
4.2%
8.5%
44%
2%
25%
12%
56%
0.75%
0.75%
All nutrients comparison - raw data values
Nutrient
DV% diff.
Sodium
1804mg
54mg
76%
Phosphorus
627mg
109mg
74%
Calcium
853mg
130mg
72%
Saturated fat
15.371g
2.591g
58%
Selenium
34.4µg
4.2µg
55%
Protein
28.42g
4.55g
48%
Vitamin B12
1.4µg
0.45µg
40%
Fats
27.84g
4.19g
36%
Zinc
4.2mg
0.46mg
34%
Vitamin A
262µg
59µg
23%
Calories
420kcal
88kcal
17%
Monounsaturated fat
7.13g
1.302g
15%
Vitamin B2
0.358mg
0.19mg
13%
Cholesterol
86mg
59mg
9%
Polyunsaturated fat
1.386g
0.198g
8%
Choline
14.1mg
52.2mg
7%
Vitamin D*
21 IU
49 IU
4%
Vitamin D
0.5µg
1.2µg
4%
Magnesium
34mg
19mg
4%
Iron
0.49mg
0.2mg
4%
Copper
0.04mg
0.013mg
3%
Manganese
0.071mg
0.005mg
3%
Vitamin C
0mg
1.5mg
2%
Carbs
13.91g
8.05g
2%
Vitamin E
0.53mg
0.21mg
2%
Vitamin B6
0.081mg
0.05mg
2%
Vitamin B1
0.026mg
0.034mg
1%
Vitamin B5
0.45mg
0.417mg
1%
Vitamin K
1.7µg
0.3µg
1%
Folate
6µg
1µg
1%
Protein per 100 calories
6.8g
5.2g
N/A
Calories per 10 g protein
148kcal
193kcal
N/A
Weight per 100 calories
24g
114g
N/A
Unsaturated / Saturated Fat ratio
0.55
0.58
N/A
Net carbs
13.91g
8.05g
N/A
Potassium
180mg
165mg
0%
Sugar
0.07g
8.05g
N/A
Vitamin B3
0.08mg
0.105mg
0%
Trans fat
0.876g
N/A
Tryptophan
0.383mg
0.085mg
0%
Threonine
1.075mg
0.201mg
0%
Isoleucine
1.455mg
0.237mg
0%
Leucine
2.747mg
0.383mg
0%
Lysine
2.201mg
0.257mg
0%
Methionine
0.751mg
0.12mg
0%
Phenylalanine
1.538mg
0.225mg
0%
Valine
1.865mg
0.289mg
0%
Histidine
0.806mg
0.108mg
0%
Fructose
0g
0.04g
0%
Omega-3 - ALA
0.102g
N/A
Omega-3 - DPA
0.015g
0g
N/A
Omega-3 - Eicosatrienoic acid
0.002g
N/A
Omega-6 - Gamma-linoleic acid
0.002g
N/A
Omega-6 - Dihomo-gamma-linoleic acid
0.026g
N/A
Omega-6 - Eicosadienoic acid
0.006g
N/A
Omega-6 - Linoleic acid
0.87g
N/A
Macronutrient Comparison
Macronutrient breakdown side-by-side comparison
4
28%
28%
14%
23%
7%
Protein:
28.42 g
Fats:
27.84 g
Carbs:
13.91 g
Water:
22.65 g
Other:
7.18 g
1
5%
4%
8%
83%
Protein:
4.55 g
Fats:
4.19 g
Carbs:
8.05 g
Water:
82.54 g
Other:
0.67 g
Contains
more
Protein Protein
+524.6%
Contains
more
Fats Fats
+564.4%
Contains
more
Carbs Carbs
+72.8%
Contains
more
Other Other
+971.6%
Contains
more
Water Water
+264.4%
Fat Type Comparison
Fat type breakdown side-by-side comparison
2
64%
30%
6%
Saturated fat:
Sat. Fat
15.371 g
Monounsaturated fat:
Mono. Fat
7.13 g
Polyunsaturated fat:
Poly. Fat
1.386 g
1
63%
32%
5%
Saturated fat:
Sat. Fat
2.591 g
Monounsaturated fat:
Mono. Fat
1.302 g
Polyunsaturated fat:
Poly. Fat
0.198 g
Contains
more
Mono. Fat Monounsaturated fat
+447.6%
Contains
more
Poly. Fat Polyunsaturated fat
+600%
Contains
less
Sat. Fat Saturated fat
-83.1%
Carbohydrate type comparison
Carbohydrate type breakdown side-by-side comparison
1
100%
Starch:
0 g
Sucrose:
0 g
Glucose:
0 g
Fructose:
0 g
Lactose:
0 g
Maltose:
0 g
Galactose:
0.07 g
5
97%
Starch:
0 g
Sucrose:
0.04 g
Glucose:
0.07 g
Fructose:
0.04 g
Lactose:
7.84 g
Maltose:
0.04 g
Galactose:
0.04 g
Contains
more
Galactose Galactose
+75%
Contains
more
Sucrose Sucrose
+∞%
Contains
more
Glucose Glucose
+∞%
Contains
more
Fructose Fructose
+∞%
Contains
more
Lactose Lactose
+∞%
Contains
more
Maltose Maltose
+∞%