
Pea soup vs. Shark fin soup — In-Depth Nutrition Comparison
Compare
How are pea soup and shark fin soup different?
- Pea soup is higher in manganese and fiber; however, shark fin soup is richer in vitamin B12 and omega-3 (DPA).
- Pea soup has less sodium.
Soup, pea, green, canned, prepared with equal volume water and Soup, shark fin, restaurant-prepared are the varieties used in this article.
Infographic
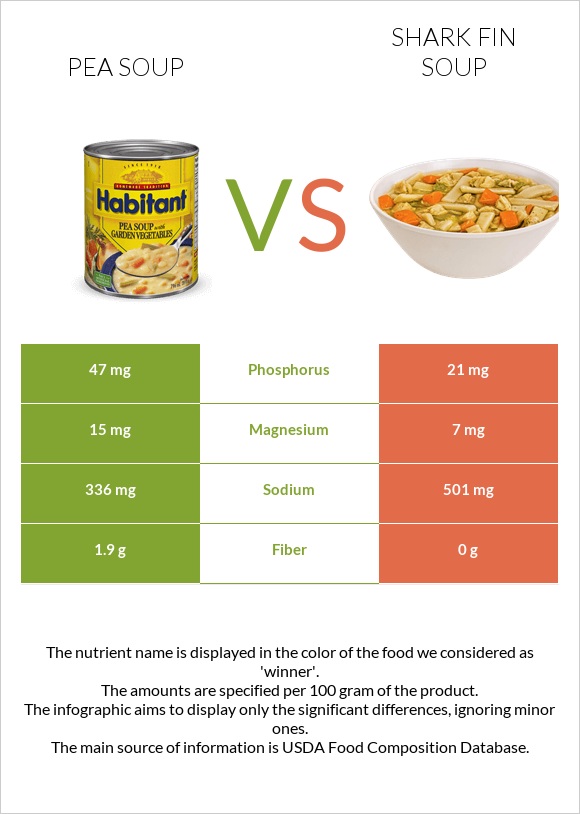
Infographic link
Mineral Comparison
The mineral comparison score is based on which food has a more favorable amount of each mineral. The �coverage� charts below show how much of the daily mineral needs are covered by the selected amount of each food.
| Contains more MagnesiumMagnesium | +114.3% |
| Contains more CalciumCalcium | +20% |
| Contains more PotassiumPotassium | +34% |
| Contains more CopperCopper | +35.2% |
| Contains more PhosphorusPhosphorus | +123.8% |
| Contains less SodiumSodium | -32.9% |
| Contains more ManganeseManganese | +920.8% |
| Contains more SeleniumSelenium | +∞% |
Vitamin Comparison
The vitamin comparison score is based on the number of vitamins in which one food is richer than the other. The �coverage� charts below show how much of the daily vitamin needs are covered by the selected amount of each food.
| Contains more Vitamin CVitamin C | +500% |
| Contains more Vitamin AVitamin A | +∞% |
| Contains more Vitamin EVitamin E | +∞% |
| Contains more Vitamin B1Vitamin B1 | +48.1% |
| Contains more Vitamin KVitamin K | +∞% |
| Contains more Vitamin B2Vitamin B2 | +56% |
| Contains more Vitamin B5Vitamin B5 | +165.3% |
| Contains more Vitamin B6Vitamin B6 | +30% |
| Contains more Vitamin B12Vitamin B12 | +∞% |
| Contains more FolateFolate | +800% |
All nutrients comparison - raw data values
| Nutrient |  |
 |
DV% diff. |
| Manganese | 0.245mg | 0.024mg | 10% |
| Fiber | 1.9g | 0g | 8% |
| Vitamin B12 | 0µg | 0.19µg | 8% |
| Sodium | 336mg | 501mg | 7% |
| Selenium | 3.6µg | 7% | |
| Copper | 0.146mg | 0.108mg | 4% |
| Phosphorus | 47mg | 21mg | 4% |
| Iron | 0.73mg | 0.94mg | 3% |
| Carbs | 9.88g | 3.8g | 2% |
| Magnesium | 15mg | 7mg | 2% |
| Zinc | 0.64mg | 0.82mg | 2% |
| Vitamin B5 | 0.049mg | 0.13mg | 2% |
| Folate | 1µg | 9µg | 2% |
| Choline | 13.2mg | 2% | |
| Calories | 61kcal | 46kcal | 1% |
| Fats | 1.09g | 2g | 1% |
| Vitamin C | 0.6mg | 0.1mg | 1% |
| Cholesterol | 0mg | 2mg | 1% |
| Potassium | 71mg | 53mg | 1% |
| Vitamin E | 0.09mg | 1% | |
| Vitamin B1 | 0.04mg | 0.027mg | 1% |
| Vitamin B2 | 0.025mg | 0.039mg | 1% |
| Monounsaturated fat | 0.372g | 0.583g | 1% |
| Polyunsaturated fat | 0.142g | 0.341g | 1% |
| Protein | 3.2g | 3.2g | 0% |
| Protein per 100 calories | 5.2g | 7g | N/A |
| Calories per 10 g protein | 191kcal | 144kcal | N/A |
| Weight per 100 calories | 164g | 217g | N/A |
| Net carbs | 7.98g | 3.8g | N/A |
| Calcium | 12mg | 10mg | 0% |
| Sugar | 3.19g | N/A | |
| Vitamin A | 3µg | 0µg | 0% |
| Vitamin B3 | 0.462mg | 0.493mg | 0% |
| Vitamin B6 | 0.02mg | 0.026mg | 0% |
| Vitamin K | 0.2µg | 0% | |
| Saturated fat | 0.524g | 0.501g | 0% |
| Omega-3 (EPA) | 0g | 0.086g | N/A |
| Omega-3 (DHA) | 0g | 0.121g | N/A |
| Omega-3 (DPA) | 0g | 0.042g | N/A |
Macronutrient Comparison
Macronutrient breakdown side-by-side comparison
Protein:
3.2 g
Fats:
1.09 g
Carbs:
9.88 g
Water:
84.55 g
Other:
1.28 g
Protein:
3.2 g
Fats:
2 g
Carbs:
3.8 g
Water:
90.13 g
Other:
0.87 g
| Contains more CarbsCarbs | +160% |
| Contains more FatsFats | +83.5% |
~equal in
Protein
~3.2g
~equal in
Water
~90.13g
Fat Type Comparison
Fat type breakdown side-by-side comparison
Saturated fat:
Sat. Fat
0.524 g
Monounsaturated fat:
Mono. Fat
0.372 g
Polyunsaturated fat:
Poly. Fat
0.142 g
Saturated fat:
Sat. Fat
0.501 g
Monounsaturated fat:
Mono. Fat
0.583 g
Polyunsaturated fat:
Poly. Fat
0.341 g
| Contains more Mono. FatMonounsaturated fat | +56.7% |
| Contains more Poly. FatPolyunsaturated fat | +140.1% |
~equal in
Saturated fat
~0.501g


