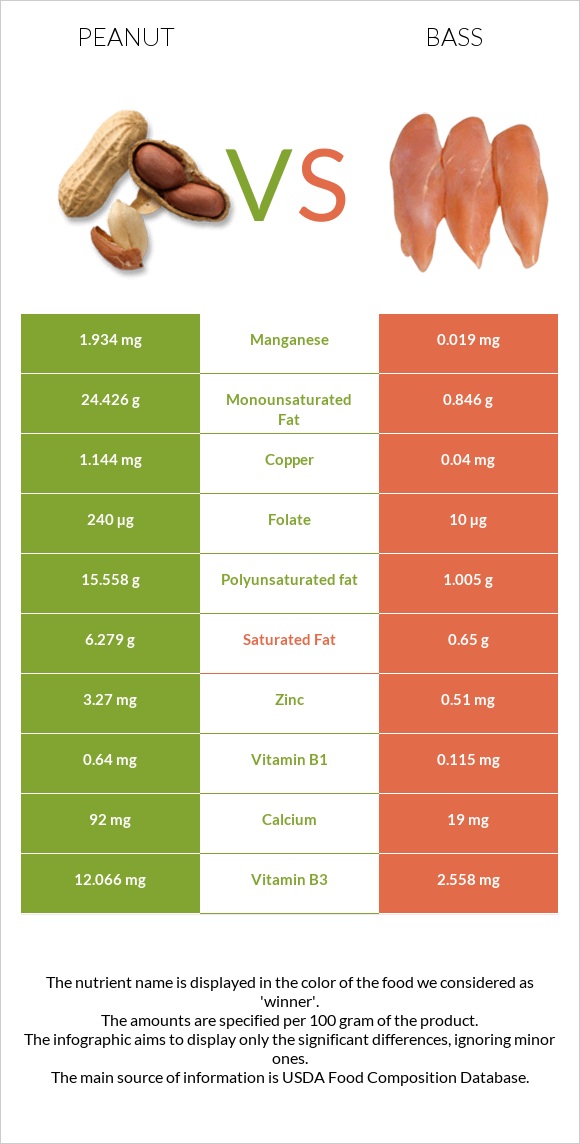
A recap on the differences between peanuts and sea bass Peanuts are higher in copper, manganese, vitamin B3, folate, iron, vitamin B1, and fiber, yet sea bass is higher in vitamin B12 and selenium. Sea bass covers your daily vitamin B12 needs 184% more than peanuts. The glycemic index of sea bass is lower. Food varieties used in this article are Peanuts, all types, raw and Fish, bass, striped, cooked, dry heat .
Infographic
Mineral Comparison
Mineral comparison score is based on the number of minerals by which one or the other food is richer. The "coverage" charts below show how much of the daily needs can be covered by 300 grams of the food.
9
100 g
300 g
1 oz - 28.35g 1 cup - 146g
Magnesium
Magnesium
Calcium
Calcium
Potassium
Potassium
Iron
Iron
Copper
Copper
Zinc
Zinc
Phosphorus
Phosphorus
Sodium
Sodium
Manganese
Manganese
Selenium
Selenium
120%
28%
62%
172%
381%
89%
161%
2.3%
252%
39%
1
100 g
300 g
3 oz - 85g 1 fillet - 124g
Magnesium
Magnesium
Calcium
Calcium
Potassium
Potassium
Iron
Iron
Copper
Copper
Zinc
Zinc
Phosphorus
Phosphorus
Sodium
Sodium
Manganese
Manganese
Selenium
Selenium
36%
5.7%
29%
41%
13%
14%
109%
11%
2.5%
255%
Vitamin Comparison
Vitamin comparison score is based on the number of vitamins by which one or the other food is richer. The "coverage" charts below show how much of the daily needs can be covered by 300 grams of the food.
6
100 g
300 g
1 oz - 28.35g 1 cup - 146g
Vitamin C
Vit. C
Vitamin D
Vit. D
Vitamin A
Vit. A
Vitamin E
Vit. E
Vitamin B1
Vit. B1
Vitamin B2
Vit. B2
Vitamin B3
Vit. B3
Vitamin B5
Vit. B5
Vitamin B6
Vit. B6
Vitamin B12
Vit. B12
Vitamin K
Vit. K
Folate
Folate
0%
0%
0%
167%
160%
31%
226%
106%
80%
0%
0%
180%
2
100 g
300 g
3 oz - 85g 1 fillet - 124g
Vitamin C
Vit. C
Vitamin D
Vit. D
Vitamin A
Vit. A
Vitamin E
Vit. E
Vitamin B1
Vit. B1
Vitamin B2
Vit. B2
Vitamin B3
Vit. B3
Vitamin B5
Vit. B5
Vitamin B6
Vit. B6
Vitamin B12
Vit. B12
Vitamin K
Vit. K
Folate
Folate
0%
0%
10%
0%
29%
8.5%
48%
52%
80%
551%
0%
7.5%
All nutrients comparison - raw data values
Nutrient
DV% diff.
Vitamin B12
0µg
4.41µg
184%
Copper
1.144mg
0.04mg
123%
Polyunsaturated fat
15.558g
1.005g
97%
Manganese
1.934mg
0.019mg
83%
Selenium
7.2µg
46.8µg
72%
Fats
49.24g
2.99g
71%
Vitamin B3
12.066mg
2.558mg
59%
Monounsaturated fat
24.426g
0.846g
59%
Folate
240µg
10µg
58%
Vitamin E
8.33mg
56%
Iron
4.58mg
1.08mg
44%
Vitamin B1
0.64mg
0.115mg
44%
Cholesterol
0mg
103mg
34%
Fiber
8.5g
0g
34%
Magnesium
168mg
51mg
28%
Saturated fat
6.279g
0.65g
26%
Zinc
3.27mg
0.51mg
25%
Calories
567kcal
124kcal
22%
Vitamin B5
1.767mg
0.865mg
18%
Phosphorus
376mg
254mg
17%
Potassium
705mg
328mg
11%
Choline
52.5mg
10%
Vitamin B2
0.135mg
0.037mg
8%
Calcium
92mg
19mg
7%
Protein
25.8g
22.73g
6%
Carbs
16.13g
0g
5%
Sodium
18mg
88mg
3%
Vitamin A
0µg
31µg
3%
Protein per 100 calories
4.6g
18g
N/A
Calories per 10 g protein
220kcal
55kcal
N/A
Weight per 100 calories
18g
81g
N/A
Unsaturated / Saturated Fat ratio
6.4
2.8
N/A
Net carbs
7.63g
0g
N/A
Sugar
4.72g
N/A
Vitamin B6
0.348mg
0.346mg
0%
Tryptophan
0.25mg
0.255mg
0%
Threonine
0.883mg
0.997mg
0%
Isoleucine
0.907mg
1.047mg
0%
Leucine
1.672mg
1.848mg
0%
Lysine
0.926mg
2.088mg
0%
Methionine
0.317mg
0.673mg
0%
Phenylalanine
1.377mg
0.887mg
0%
Valine
1.082mg
1.171mg
0%
Histidine
0.652mg
0.669mg
0%
Omega-3 - EPA
0g
0.217g
N/A
Omega-3 - DHA
0g
0.75g
N/A
Macronutrient Comparison
Macronutrient breakdown side-by-side comparison
4
26%
49%
16%
7%
2%
Protein:
25.8 g
Fats:
49.24 g
Carbs:
16.13 g
Water:
6.5 g
Other:
2.33 g
1
23%
3%
73%
Protein:
22.73 g
Fats:
2.99 g
Carbs:
0 g
Water:
73.36 g
Other:
0.92 g
Contains
more
Protein Protein
+13.5%
Contains
more
Fats Fats
+1546.8%
Contains
more
Carbs Carbs
+∞%
Contains
more
Other Other
+153.3%
Contains
more
Water Water
+1028.6%
Fat Type Comparison
Fat type breakdown side-by-side comparison
2
14%
53%
34%
Saturated fat:
Sat. Fat
6.279 g
Monounsaturated fat:
Mono. Fat
24.426 g
Polyunsaturated fat:
Poly. Fat
15.558 g
1
26%
34%
40%
Saturated fat:
Sat. Fat
0.65 g
Monounsaturated fat:
Mono. Fat
0.846 g
Polyunsaturated fat:
Poly. Fat
1.005 g
Contains
more
Mono. Fat Monounsaturated fat
+2787.2%
Contains
more
Poly. Fat Polyunsaturated fat
+1448.1%
Contains
less
Sat. Fat Saturated fat
-89.6%