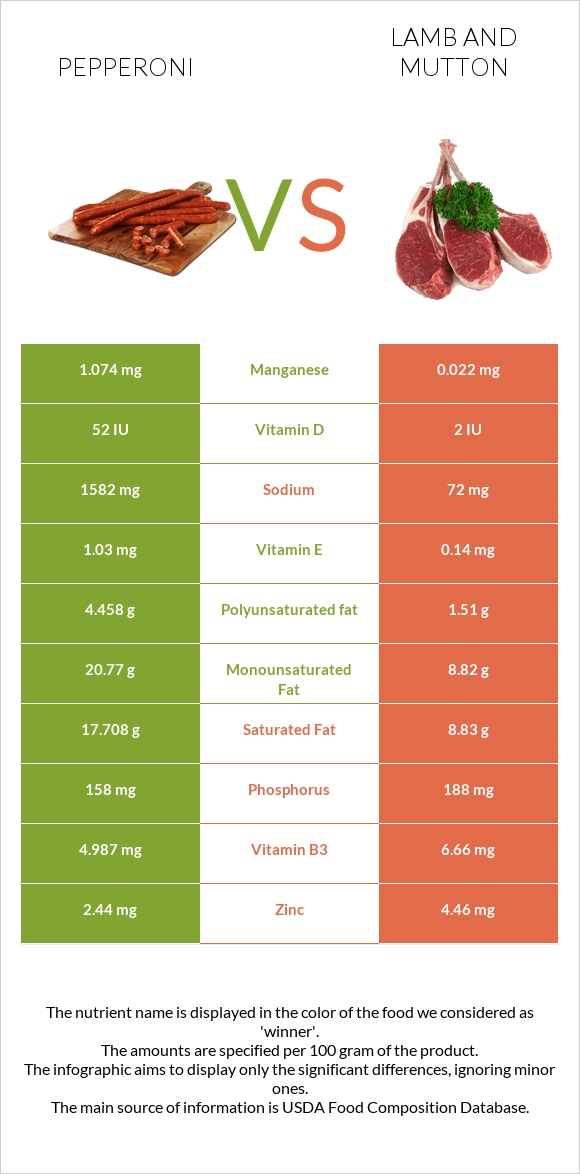
How are pepperoni and lamb different? Pepperoni is higher in manganese, vitamin B6, and vitamin B1; however, lamb is richer in vitamin B12, zinc, vitamin B3, choline, and iron. Daily need coverage for sodium for pepperoni is 66% higher. Pepperoni contains 49 times more manganese than lamb. While pepperoni contains 1.074mg of manganese, lamb contains only 0.022mg. Lamb has less sodium. Lamb has a lower glycemic index (0) than pepperoni (28). Pepperoni, beef, and pork, sliced and Lamb, domestic, composite of trimmed retail cuts, separable lean, and fat, trimmed to 1/4" fat, choice, cooked are the varieties used in this article.
Infographic
Mineral Comparison
Mineral comparison score is based on the number of minerals by which one or the other food is richer. The "coverage" charts below show how much of the daily needs can be covered by 300 grams of the food.
2
100 g
300 g
1 piece - 2g 1 oz - 28g 3 oz - 85g
Magnesium
Magnesium
Calcium
Calcium
Potassium
Potassium
Iron
Iron
Copper
Copper
Zinc
Zinc
Phosphorus
Phosphorus
Sodium
Sodium
Manganese
Manganese
Selenium
Selenium
13%
5.7%
24%
50%
30%
67%
68%
206%
140%
158%
7
100 g
300 g
3 oz - 85g 1 piece, cooked, excluding refuse (yield from 1 lb raw meat with refuse) - 242g
Magnesium
Magnesium
Calcium
Calcium
Potassium
Potassium
Iron
Iron
Copper
Copper
Zinc
Zinc
Phosphorus
Phosphorus
Sodium
Sodium
Manganese
Manganese
Selenium
Selenium
16%
5.1%
27%
71%
40%
122%
81%
9.4%
2.9%
144%
Vitamin Comparison
Vitamin comparison score is based on the number of vitamins by which one or the other food is richer. The "coverage" charts below show how much of the daily needs can be covered by 300 grams of the food.
6
100 g
300 g
1 piece - 2g 1 oz - 28g 3 oz - 85g
Vitamin C
Vit. C
Vitamin D
Vit. D
Vitamin A
Vit. A
Vitamin E
Vit. E
Vitamin B1
Vit. B1
Vitamin B2
Vit. B2
Vitamin B3
Vit. B3
Vitamin B5
Vit. B5
Vitamin B6
Vit. B6
Vitamin B12
Vit. B12
Vitamin K
Vit. K
Folate
Folate
0%
20%
0%
21%
68%
59%
94%
56%
84%
163%
15%
3.8%
3
100 g
300 g
3 oz - 85g 1 piece, cooked, excluding refuse (yield from 1 lb raw meat with refuse) - 242g
Vitamin C
Vit. C
Vitamin D
Vit. D
Vitamin A
Vit. A
Vitamin E
Vit. E
Vitamin B1
Vit. B1
Vitamin B2
Vit. B2
Vitamin B3
Vit. B3
Vitamin B5
Vit. B5
Vitamin B6
Vit. B6
Vitamin B12
Vit. B12
Vitamin K
Vit. K
Folate
Folate
0%
1.5%
0%
2.8%
25%
58%
125%
40%
30%
319%
12%
14%
All nutrients comparison - raw data values
Nutrient
DV% diff.
Sodium
1582mg
72mg
66%
Vitamin B12
1.3µg
2.55µg
52%
Manganese
1.074mg
0.022mg
46%
Saturated fat
17.708g
8.83g
40%
Fats
46.28g
20.94g
39%
Monounsaturated fat
20.77g
8.82g
30%
Polyunsaturated fat
4.458g
1.51g
20%
Zinc
2.44mg
4.46mg
18%
Vitamin B6
0.362mg
0.13mg
18%
Vitamin B1
0.271mg
0.1mg
14%
Calories
504kcal
294kcal
11%
Protein
19.25g
24.52g
11%
Vitamin B3
4.987mg
6.66mg
10%
Choline
51.2mg
93.7mg
8%
Iron
1.33mg
1.88mg
7%
Vitamin D*
52 IU
2 IU
6%
Vitamin D
1.3µg
0.1µg
6%
Vitamin E
1.03mg
0.14mg
6%
Selenium
29µg
26.4µg
5%
Vitamin B5
0.93mg
0.66mg
5%
Phosphorus
158mg
188mg
4%
Copper
0.091mg
0.119mg
3%
Folate
5µg
18µg
3%
Magnesium
18mg
23mg
1%
Potassium
274mg
310mg
1%
Vitamin B2
0.257mg
0.25mg
1%
Vitamin K
5.8µg
4.6µg
1%
Protein per 100 calories
3.8g
8.3g
N/A
Calories per 10 g protein
262kcal
120kcal
N/A
Weight per 100 calories
20g
34g
N/A
Unsaturated / Saturated Fat ratio
1.4
1.2
N/A
Net carbs
1.18g
0g
N/A
Carbs
1.18g
0g
0%
Cholesterol
97mg
97mg
0%
Calcium
19mg
17mg
0%
Trans fat
1.527g
N/A
Tryptophan
0.23mg
0.287mg
0%
Threonine
0.869mg
1.05mg
0%
Isoleucine
0.901mg
1.183mg
0%
Leucine
1.575mg
1.908mg
0%
Lysine
1.652mg
2.166mg
0%
Methionine
0.511mg
0.629mg
0%
Phenylalanine
0.778mg
0.998mg
0%
Valine
0.987mg
1.323mg
0%
Histidine
0.688mg
0.777mg
0%
Omega-3 - EPA
0.004g
0g
N/A
Omega-3 - DHA
0.004g
0g
N/A
Omega-3 - ALA
0.164g
N/A
Omega-3 - DPA
0.02g
0g
N/A
Omega-3 - Eicosatrienoic acid
0.018g
N/A
Omega-6 - Gamma-linoleic acid
0.002g
N/A
Omega-6 - Dihomo-gamma-linoleic acid
0.04g
N/A
Omega-6 - Eicosadienoic acid
0.136g
N/A
Omega-6 - Linoleic acid
3.605g
N/A
Macronutrient Comparison
Macronutrient breakdown side-by-side comparison
3
19%
46%
29%
5%
Protein:
19.25 g
Fats:
46.28 g
Carbs:
1.18 g
Water:
28.55 g
Other:
4.74 g
2
25%
21%
54%
Protein:
24.52 g
Fats:
20.94 g
Carbs:
0 g
Water:
53.72 g
Other:
0.82 g
Contains
more
Fats Fats
+121%
Contains
more
Carbs Carbs
+∞%
Contains
more
Other Other
+478%
Contains
more
Protein Protein
+27.4%
Contains
more
Water Water
+88.2%
Fat Type Comparison
Fat type breakdown side-by-side comparison
2
41%
48%
10%
Saturated fat:
Sat. Fat
17.708 g
Monounsaturated fat:
Mono. Fat
20.77 g
Polyunsaturated fat:
Poly. Fat
4.458 g
1
46%
46%
8%
Saturated fat:
Sat. Fat
8.83 g
Monounsaturated fat:
Mono. Fat
8.82 g
Polyunsaturated fat:
Poly. Fat
1.51 g
Contains
more
Mono. Fat Monounsaturated fat
+135.5%
Contains
more
Poly. Fat Polyunsaturated fat
+195.2%
Contains
less
Sat. Fat Saturated fat
-50.1%