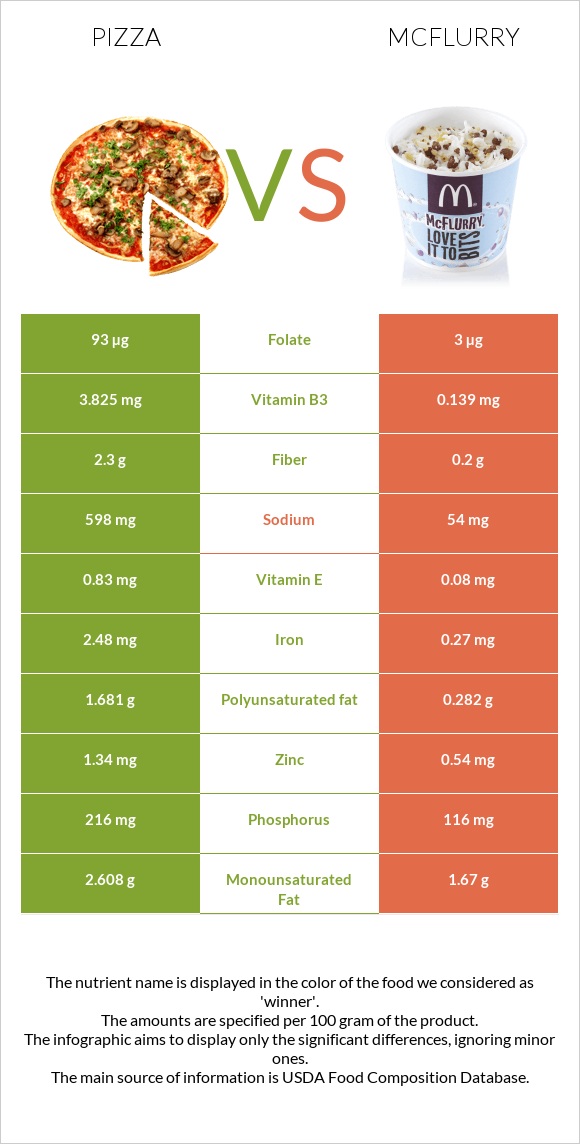
What are the differences between pizza and mcFlurry? Pizza is higher in vitamin B1, iron, vitamin B3, folate, phosphorus, manganese, fiber, and zinc; however, mcFlurry is richer in vitamin B12. Pizza's daily need coverage for vitamin B1 is 28% more. McFlurry contains 31 times less folate than pizza. Pizza contains 93µg of folate, while mcFlurry contains 3µg. McFlurry has less sodium. We used Fast Food, Pizza Chain, 14" pizza, cheese topping, regular crust and McDONALD'S, McFLURRY with M&M'S CANDIES types in this article.
Infographic
Mineral Comparison
Mineral comparison score is based on the number of minerals by which one or the other food is richer. The "coverage" charts below show how much of the daily needs can be covered by 300 grams of the food.
8
100 g
300 g
1 slice - 107g 1 pizza - 853g
Magnesium
Magnesium
Calcium
Calcium
Potassium
Potassium
Iron
Iron
Copper
Copper
Zinc
Zinc
Phosphorus
Phosphorus
Sodium
Sodium
Manganese
Manganese
Selenium
Selenium
17%
56%
15%
93%
35%
37%
93%
78%
47%
109%
2
100 g
300 g
1 regular (12 fl oz) - 348g 1 large (16 fl oz) - 504g
Magnesium
Magnesium
Calcium
Calcium
Potassium
Potassium
Iron
Iron
Copper
Copper
Zinc
Zinc
Phosphorus
Phosphorus
Sodium
Sodium
Manganese
Manganese
Selenium
Selenium
12%
41%
18%
10%
15%
15%
50%
7%
6%
0%
Vitamin Comparison
Vitamin comparison score is based on the number of vitamins by which one or the other food is richer. The "coverage" charts below show how much of the daily needs can be covered by 300 grams of the food.
8
100 g
300 g
1 slice - 107g 1 pizza - 853g
Vitamin C
Vit. C
Vitamin D
Vit. D
Vitamin A
Vit. A
Vitamin E
Vit. E
Vitamin B1
Vit. B1
Vitamin B2
Vit. B2
Vitamin B3
Vit. B3
Vitamin B5
Vit. B5
Vitamin B6
Vit. B6
Vitamin B12
Vit. B12
Vitamin K
Vit. K
Folate
Folate
4.7%
0%
23%
17%
98%
45%
72%
0%
18%
53%
17%
70%
3
100 g
300 g
1 regular (12 fl oz) - 348g 1 large (16 fl oz) - 504g
Vitamin C
Vit. C
Vitamin D
Vit. D
Vitamin A
Vit. A
Vitamin E
Vit. E
Vitamin B1
Vit. B1
Vitamin B2
Vit. B2
Vitamin B3
Vit. B3
Vitamin B5
Vit. B5
Vitamin B6
Vit. B6
Vitamin B12
Vit. B12
Vitamin K
Vit. K
Folate
Folate
0%
0%
0%
1.6%
13%
56%
2.6%
44%
12%
75%
0%
2.3%
All nutrients comparison - raw data values
Nutrient
DV% diff.
Selenium
19.9µg
36%
Iron
2.48mg
0.27mg
28%
Vitamin B1
0.39mg
0.051mg
28%
Sodium
598mg
54mg
24%
Vitamin B3
3.825mg
0.139mg
23%
Folate
93µg
3µg
23%
Protein
11.39g
4.02g
15%
Vitamin B5
0.73mg
15%
Phosphorus
216mg
116mg
14%
Manganese
0.36mg
0.046mg
14%
Starch
26.95g
11%
Polyunsaturated fat
1.681g
0.282g
9%
Fiber
2.3g
0.2g
8%
Vitamin A
69µg
8%
Vitamin B12
0.42µg
0.6µg
8%
Copper
0.105mg
0.044mg
7%
Zinc
1.34mg
0.54mg
7%
Vitamin K
6.7µg
6%
Fats
9.69g
6.46g
5%
Calcium
188mg
135mg
5%
Vitamin E
0.83mg
0.08mg
5%
Saturated fat
4.465g
3.402g
5%
Calories
266kcal
177kcal
4%
Vitamin B2
0.195mg
0.243mg
4%
Choline
16.4mg
3%
Vitamin C
1.4mg
2%
Carbs
33.33g
26.82g
2%
Magnesium
24mg
17mg
2%
Vitamin B6
0.08mg
0.053mg
2%
Monounsaturated fat
2.608g
1.67g
2%
Potassium
172mg
208mg
1%
Fructose
1g
0.21g
1%
Protein per 100 calories
4.3g
2.3g
N/A
Calories per 10 g protein
234kcal
440kcal
N/A
Weight per 100 calories
38g
56g
N/A
Unsaturated / Saturated Fat ratio
0.96
0.57
N/A
Net carbs
31.03g
26.62g
N/A
Cholesterol
17mg
16mg
0%
Sugar
3.58g
24.37g
N/A
Trans fat
0.241g
0.281g
N/A
Threonine
0.41mg
0%
Isoleucine
0.564mg
0%
Leucine
1.139mg
0%
Lysine
0.77mg
0%
Methionine
0.264mg
0%
Phenylalanine
0.664mg
0%
Valine
0.72mg
0%
Histidine
0.355mg
0%
Omega-3 - EPA
0.004g
N/A
Omega-3 - ALA
0.175g
N/A
Omega-3 - DPA
0.004g
N/A
Omega-6 - Gamma-linoleic acid
0.003g
N/A
Omega-6 - Dihomo-gamma-linoleic acid
0.009g
N/A
Omega-6 - Eicosadienoic acid
0.003g
0g
N/A
Omega-6 - Linoleic acid
1.367g
N/A
Macronutrient Comparison
Macronutrient breakdown side-by-side comparison
4
11%
10%
33%
43%
2%
Protein:
11.39 g
Fats:
9.69 g
Carbs:
33.33 g
Water:
43.17 g
Other:
2.42 g
1
4%
6%
27%
62%
Protein:
4.02 g
Fats:
6.46 g
Carbs:
26.82 g
Water:
61.74 g
Other:
0.96 g
Contains
more
Protein Protein
+183.3%
Contains
more
Fats Fats
+50%
Contains
more
Carbs Carbs
+24.3%
Contains
more
Other Other
+152.1%
Contains
more
Water Water
+43%
Fat Type Comparison
Fat type breakdown side-by-side comparison
2
51%
30%
19%
Saturated fat:
Sat. Fat
4.465 g
Monounsaturated fat:
Mono. Fat
2.608 g
Polyunsaturated fat:
Poly. Fat
1.681 g
1
64%
31%
5%
Saturated fat:
Sat. Fat
3.402 g
Monounsaturated fat:
Mono. Fat
1.67 g
Polyunsaturated fat:
Poly. Fat
0.282 g
Contains
more
Mono. Fat Monounsaturated fat
+56.2%
Contains
more
Poly. Fat Polyunsaturated fat
+496.1%
Contains
less
Sat. Fat Saturated fat
-23.8%
Carbohydrate type comparison
Carbohydrate type breakdown side-by-side comparison
5
88%
3%
3%
3%
Starch:
26.95 g
Sucrose:
0.2 g
Glucose:
0.78 g
Fructose:
1 g
Lactose:
0.42 g
Maltose:
1.05 g
Galactose:
0.13 g
2
69%
3%
26%
Starch:
0 g
Sucrose:
16.9 g
Glucose:
0.75 g
Fructose:
0.21 g
Lactose:
6.23 g
Maltose:
0.28 g
Galactose:
0 g
Contains
more
Starch Starch
+∞%
Contains
more
Fructose Fructose
+376.2%
Contains
more
Maltose Maltose
+275%
Contains
more
Galactose Galactose
+∞%
Contains
more
Sucrose Sucrose
+8350%
Contains
more
Lactose Lactose
+1383.3%