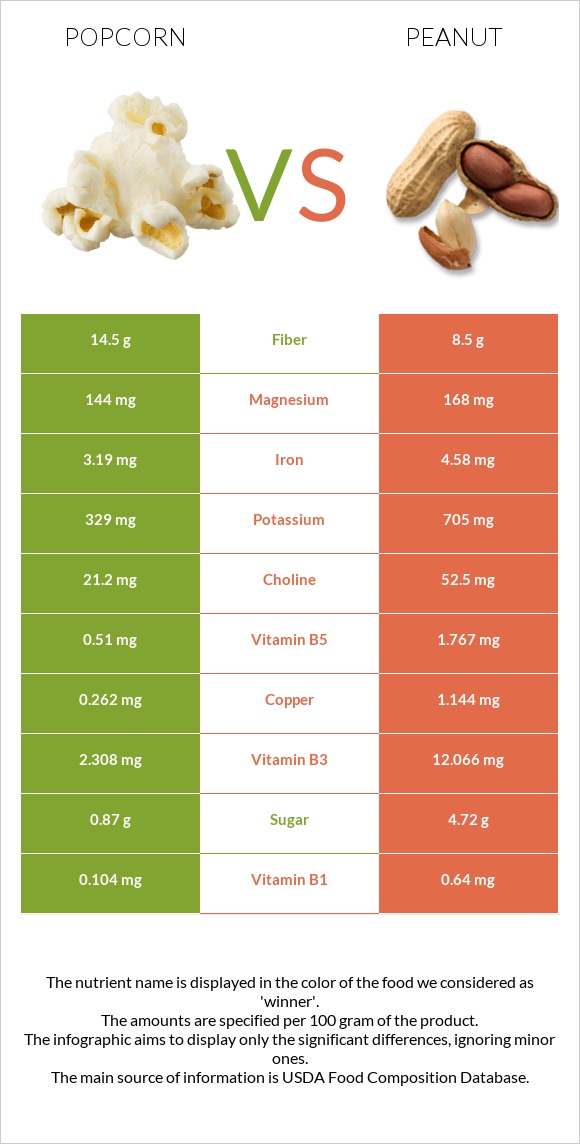
Differences between popcorn and peanuts Popcorn has more fiber, while peanuts have more copper, vitamin B3, vitamin E, folate, vitamin B1, manganese, vitamin B5, and iron. Peanuts' daily need coverage for copper is 98% higher. Peanuts contain 2 times less fiber than popcorn. Popcorn contains 14.5g of fiber, while peanuts contain 8.5g. The amount of saturated fat in popcorn is lower. Peanuts have a lower glycemic index. The glycemic index of peanuts is 13, while the glycemic index of popcorn is 62. The food types used in this comparison are Snacks, popcorn, air-popped and Peanuts, all types, raw .
Infographic
Mineral Comparison
Mineral comparison score is based on the number of minerals by which one or the other food is richer. The "coverage" charts below show how much of the daily needs can be covered by 300 grams of the food.
1
100 g
300 g
1 cup - 8g 1 oz - 28.35g
Magnesium
Magnesium
Calcium
Calcium
Potassium
Potassium
Iron
Iron
Copper
Copper
Zinc
Zinc
Phosphorus
Phosphorus
Sodium
Sodium
Manganese
Manganese
Selenium
Selenium
103%
2.1%
29%
120%
87%
84%
153%
1%
145%
0%
7
100 g
300 g
1 oz - 28.35g 1 cup - 146g
Magnesium
Magnesium
Calcium
Calcium
Potassium
Potassium
Iron
Iron
Copper
Copper
Zinc
Zinc
Phosphorus
Phosphorus
Sodium
Sodium
Manganese
Manganese
Selenium
Selenium
120%
28%
62%
172%
381%
89%
161%
2.3%
252%
39%
Vitamin Comparison
Vitamin comparison score is based on the number of vitamins by which one or the other food is richer. The "coverage" charts below show how much of the daily needs can be covered by 300 grams of the food.
2
100 g
300 g
1 cup - 8g 1 oz - 28.35g
Vitamin C
Vit. C
Vitamin D
Vit. D
Vitamin A
Vit. A
Vitamin E
Vit. E
Vitamin B1
Vit. B1
Vitamin B2
Vit. B2
Vitamin B3
Vit. B3
Vitamin B5
Vit. B5
Vitamin B6
Vit. B6
Vitamin B12
Vit. B12
Vitamin K
Vit. K
Folate
Folate
0%
0%
3.3%
5.8%
26%
19%
43%
31%
36%
0%
3%
23%
7
100 g
300 g
1 oz - 28.35g 1 cup - 146g
Vitamin C
Vit. C
Vitamin D
Vit. D
Vitamin A
Vit. A
Vitamin E
Vit. E
Vitamin B1
Vit. B1
Vitamin B2
Vit. B2
Vitamin B3
Vit. B3
Vitamin B5
Vit. B5
Vitamin B6
Vit. B6
Vitamin B12
Vit. B12
Vitamin K
Vit. K
Folate
Folate
0%
0%
0%
167%
160%
31%
226%
106%
80%
0%
0%
180%
All nutrients comparison - raw data values
Nutrient
DV% diff.
Copper
0.262mg
1.144mg
98%
Polyunsaturated fat
2.318g
15.558g
88%
Fats
4.54g
49.24g
69%
Vitamin B3
2.308mg
12.066mg
61%
Monounsaturated fat
0.95g
24.426g
59%
Vitamin E
0.29mg
8.33mg
54%
Folate
31µg
240µg
52%
Vitamin B1
0.104mg
0.64mg
45%
Manganese
1.113mg
1.934mg
36%
Protein
12.94g
25.8g
26%
Saturated fat
0.637g
6.279g
26%
Vitamin B5
0.51mg
1.767mg
25%
Fiber
14.5g
8.5g
24%
Starch
54.4g
22%
Carbs
77.78g
16.13g
21%
Iron
3.19mg
4.58mg
17%
Vitamin B6
0.157mg
0.348mg
15%
Selenium
0µg
7.2µg
13%
Potassium
329mg
705mg
11%
Calories
387kcal
567kcal
9%
Calcium
7mg
92mg
9%
Magnesium
144mg
168mg
6%
Choline
21.2mg
52.5mg
6%
Vitamin B2
0.083mg
0.135mg
4%
Phosphorus
358mg
376mg
3%
Zinc
3.08mg
3.27mg
2%
Vitamin A
10µg
0µg
1%
Vitamin K
1.2µg
0µg
1%
Protein per 100 calories
3.3g
4.6g
N/A
Calories per 10 g protein
299kcal
220kcal
N/A
Weight per 100 calories
26g
18g
N/A
Unsaturated / Saturated Fat ratio
5.1
6.4
N/A
Net carbs
63.28g
7.63g
N/A
Sugar
0.87g
4.72g
N/A
Sodium
8mg
18mg
0%
Tryptophan
0.085mg
0.25mg
0%
Threonine
0.452mg
0.883mg
0%
Isoleucine
0.431mg
0.907mg
0%
Leucine
1.473mg
1.672mg
0%
Lysine
0.338mg
0.926mg
0%
Methionine
0.252mg
0.317mg
0%
Phenylalanine
0.59mg
1.377mg
0%
Valine
0.607mg
1.082mg
0%
Histidine
0.367mg
0.652mg
0%
Fructose
0.07g
0%
Macronutrient Comparison
Macronutrient breakdown side-by-side comparison
1
13%
5%
78%
3%
Protein:
12.94 g
Fats:
4.54 g
Carbs:
77.78 g
Water:
3.32 g
Other:
1.42 g
4
26%
49%
16%
7%
2%
Protein:
25.8 g
Fats:
49.24 g
Carbs:
16.13 g
Water:
6.5 g
Other:
2.33 g
Contains
more
Carbs Carbs
+382.2%
Contains
more
Protein Protein
+99.4%
Contains
more
Fats Fats
+984.6%
Contains
more
Water Water
+95.8%
Contains
more
Other Other
+64.1%
Fat Type Comparison
Fat type breakdown side-by-side comparison
1
16%
24%
59%
Saturated fat:
Sat. Fat
0.637 g
Monounsaturated fat:
Mono. Fat
0.95 g
Polyunsaturated fat:
Poly. Fat
2.318 g
2
14%
53%
34%
Saturated fat:
Sat. Fat
6.279 g
Monounsaturated fat:
Mono. Fat
24.426 g
Polyunsaturated fat:
Poly. Fat
15.558 g
Contains
less
Sat. Fat Saturated fat
-89.9%
Contains
more
Mono. Fat Monounsaturated fat
+2471.2%
Contains
more
Poly. Fat Polyunsaturated fat
+571.2%