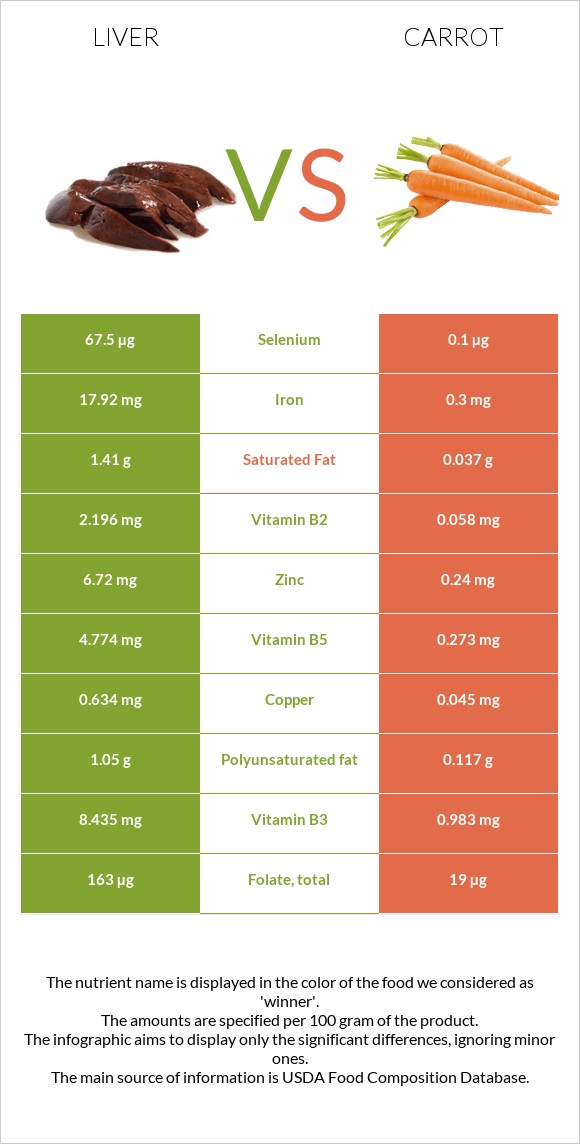
A recap on the differences between liver and carrots Carrots have less vitamin B12, iron, vitamin B2, selenium, vitamin B5, copper, zinc, vitamin B3, and folate. Liver covers your daily vitamin B12 needs 778% more than carrots. The glycemic index of carrots is higher. Food varieties used in this article are Pork, fresh, variety meats, and by-products, liver, cooked, braised and Carrots, raw .
Infographic
Mineral Comparison
Mineral comparison score is based on the number of minerals by which one or the other food is richer. The "coverage" charts below show how much of the daily needs can be covered by 300 grams of the food.
8
100 g
300 g
3 oz - 85g
Magnesium
Magnesium
Calcium
Calcium
Potassium
Potassium
Iron
Iron
Copper
Copper
Zinc
Zinc
Phosphorus
Phosphorus
Sodium
Sodium
Manganese
Manganese
Selenium
Selenium
10%
3%
13%
672%
211%
183%
103%
6.4%
39%
368%
2
100 g
300 g
1 slice - 3g 1 strip medium - 4g 1 strip large (3" long) - 7g 1 small (5-1/2" long) - 50g 1 medium - 61g 1 large (7-1/4" to 8-/1/2" long) - 72g 1 cup grated - 110g 1 cup strips or slices - 122g 1 cup chopped - 128g
Magnesium
Magnesium
Calcium
Calcium
Potassium
Potassium
Iron
Iron
Copper
Copper
Zinc
Zinc
Phosphorus
Phosphorus
Sodium
Sodium
Manganese
Manganese
Selenium
Selenium
8.6%
9.9%
28%
11%
15%
6.5%
15%
9%
19%
0.55%
Vitamin Comparison
Vitamin comparison score is based on the number of vitamins by which one or the other food is richer. The "coverage" charts below show how much of the daily needs can be covered by 300 grams of the food.
9
100 g
300 g
3 oz - 85g
Vitamin C
Vit. C
Vitamin D
Vit. D
Vitamin A
Vit. A
Vitamin E
Vit. E
Vitamin B1
Vit. B1
Vitamin B2
Vit. B2
Vitamin B3
Vit. B3
Vitamin B5
Vit. B5
Vitamin B6
Vit. B6
Vitamin B12
Vit. B12
Vitamin K
Vit. K
Folate
Folate
79%
0%
1802%
0%
65%
507%
158%
286%
132%
2334%
0%
122%
2
100 g
300 g
1 slice - 3g 1 strip medium - 4g 1 strip large (3" long) - 7g 1 small (5-1/2" long) - 50g 1 medium - 61g 1 large (7-1/4" to 8-/1/2" long) - 72g 1 cup grated - 110g 1 cup strips or slices - 122g 1 cup chopped - 128g
Vitamin C
Vit. C
Vitamin D
Vit. D
Vitamin A
Vit. A
Vitamin E
Vit. E
Vitamin B1
Vit. B1
Vitamin B2
Vit. B2
Vitamin B3
Vit. B3
Vitamin B5
Vit. B5
Vitamin B6
Vit. B6
Vitamin B12
Vit. B12
Vitamin K
Vit. K
Folate
Folate
20%
0%
278%
13%
17%
13%
18%
16%
32%
0%
33%
14%
All nutrients comparison - raw data values
Nutrient
DV% diff.
Vitamin B12
18.67µg
0µg
778%
Vitamin A
5405µg
835µg
508%
Iron
17.92mg
0.3mg
220%
Vitamin B2
2.196mg
0.058mg
164%
Selenium
67.5µg
0.1µg
123%
Cholesterol
355mg
0mg
118%
Vitamin B5
4.774mg
0.273mg
90%
Copper
0.634mg
0.045mg
65%
Zinc
6.72mg
0.24mg
59%
Protein
26.02g
0.93g
50%
Vitamin B3
8.435mg
0.983mg
47%
Folate
163µg
19µg
36%
Vitamin B6
0.57mg
0.138mg
33%
Phosphorus
241mg
35mg
29%
Vitamin C
23.6mg
5.9mg
20%
Vitamin B1
0.258mg
0.066mg
16%
Fiber
0g
2.8g
11%
Vitamin K
13.2µg
11%
Manganese
0.3mg
0.143mg
7%
Calories
165kcal
41kcal
6%
Fats
4.4g
0.24g
6%
Saturated fat
1.41g
0.037g
6%
Polyunsaturated fat
1.05g
0.117g
6%
Potassium
150mg
320mg
5%
Vitamin E
0.66mg
4%
Carbs
3.76g
9.58g
2%
Calcium
10mg
33mg
2%
Choline
8.8mg
2%
Monounsaturated fat
0.63g
0.014g
2%
Starch
1.43g
1%
Sodium
49mg
69mg
1%
Fructose
0.55g
1%
Protein per 100 calories
16g
2.3g
N/A
Calories per 10 g protein
63kcal
441kcal
N/A
Weight per 100 calories
61g
244g
N/A
Unsaturated / Saturated Fat ratio
1.2
3.5
N/A
Net carbs
3.76g
6.78g
N/A
Magnesium
14mg
12mg
0%
Sugar
4.74g
N/A
Tryptophan
0.366mg
0.012mg
0%
Threonine
1.107mg
0.191mg
0%
Isoleucine
1.32mg
0.077mg
0%
Leucine
2.319mg
0.102mg
0%
Lysine
2.007mg
0.101mg
0%
Methionine
0.645mg
0.02mg
0%
Phenylalanine
1.274mg
0.061mg
0%
Valine
1.607mg
0.069mg
0%
Histidine
0.708mg
0.04mg
0%
Omega-3 - DHA
0.03g
0g
N/A
Omega-3 - DPA
0.04g
0g
N/A
Macronutrient Comparison
Macronutrient breakdown side-by-side comparison
3
26%
4%
4%
64%
Protein:
26.02 g
Fats:
4.4 g
Carbs:
3.76 g
Water:
64.32 g
Other:
1.5 g
2
10%
88%
Protein:
0.93 g
Fats:
0.24 g
Carbs:
9.58 g
Water:
88.29 g
Other:
0.96 g
Contains
more
Protein Protein
+2697.8%
Contains
more
Fats Fats
+1733.3%
Contains
more
Other Other
+56.3%
Contains
more
Carbs Carbs
+154.8%
Contains
more
Water Water
+37.3%
Fat Type Comparison
Fat type breakdown side-by-side comparison
2
46%
20%
34%
Saturated fat:
Sat. Fat
1.41 g
Monounsaturated fat:
Mono. Fat
0.63 g
Polyunsaturated fat:
Poly. Fat
1.05 g
1
22%
8%
70%
Saturated fat:
Sat. Fat
0.037 g
Monounsaturated fat:
Mono. Fat
0.014 g
Polyunsaturated fat:
Poly. Fat
0.117 g
Contains
more
Mono. Fat Monounsaturated fat
+4400%
Contains
more
Poly. Fat Polyunsaturated fat
+797.4%
Contains
less
Sat. Fat Saturated fat
-97.4%