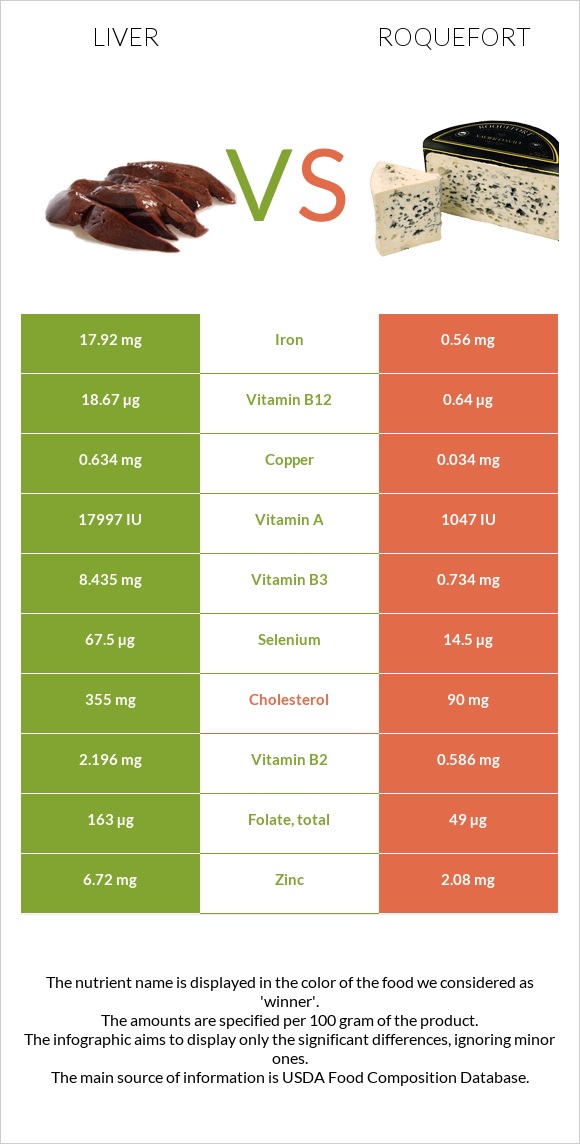
Significant differences between liver and roquefort Liver has more vitamin B12, vitamin A, iron, vitamin B2, selenium, and copper; however, roquefort is richer in calcium. Liver covers your daily vitamin B12 needs 751% more than roquefort. Roquefort has 32 times less iron than liver. Liver has 17.92mg of iron, while roquefort has 0.56mg. Roquefort contains less cholesterol. Roquefort has a higher glycemic index. The glycemic index of roquefort is 27, while the glycemic index of liver is 0. Specific food types used in this comparison are Pork, fresh, variety meats, and by-products, liver, cooked, braised and Cheese, roquefort .
Infographic
Mineral Comparison
Mineral comparison score is based on the number of minerals by which one or the other food is richer. The "coverage" charts below show how much of the daily needs can be covered by 300 grams of the food.
7
100 g
300 g
3 oz - 85g
Magnesium
Magnesium
Calcium
Calcium
Potassium
Potassium
Iron
Iron
Copper
Copper
Zinc
Zinc
Phosphorus
Phosphorus
Sodium
Sodium
Manganese
Manganese
Selenium
Selenium
10%
3%
13%
672%
211%
183%
103%
6.4%
39%
368%
3
100 g
300 g
1 oz - 28.35g 1 package (3 oz) - 85g
Magnesium
Magnesium
Calcium
Calcium
Potassium
Potassium
Iron
Iron
Copper
Copper
Zinc
Zinc
Phosphorus
Phosphorus
Sodium
Sodium
Manganese
Manganese
Selenium
Selenium
21%
199%
8%
21%
11%
57%
168%
236%
3.9%
79%
Vitamin Comparison
Vitamin comparison score is based on the number of vitamins by which one or the other food is richer. The "coverage" charts below show how much of the daily needs can be covered by 300 grams of the food.
9
100 g
300 g
3 oz - 85g
Vitamin C
Vit. C
Vitamin D
Vit. D
Vitamin A
Vit. A
Vitamin E
Vit. E
Vitamin B1
Vit. B1
Vitamin B2
Vit. B2
Vitamin B3
Vit. B3
Vitamin B5
Vit. B5
Vitamin B6
Vit. B6
Vitamin B12
Vit. B12
Vitamin K
Vit. K
Folate
Folate
79%
0%
1802%
0%
65%
507%
158%
286%
132%
2334%
0%
122%
0
100 g
300 g
1 oz - 28.35g 1 package (3 oz) - 85g
Vitamin C
Vit. C
Vitamin D
Vit. D
Vitamin A
Vit. A
Vitamin E
Vit. E
Vitamin B1
Vit. B1
Vitamin B2
Vit. B2
Vitamin B3
Vit. B3
Vitamin B5
Vit. B5
Vitamin B6
Vit. B6
Vitamin B12
Vit. B12
Vitamin K
Vit. K
Folate
Folate
0%
0%
98%
0%
10%
135%
14%
104%
29%
80%
0%
37%
All nutrients comparison - raw data values
Nutrient
DV% diff.
Vitamin B12
18.67µg
0.64µg
751%
Vitamin A
5405µg
294µg
568%
Iron
17.92mg
0.56mg
217%
Vitamin B2
2.196mg
0.586mg
124%
Selenium
67.5µg
14.5µg
96%
Cholesterol
355mg
90mg
88%
Saturated fat
1.41g
19.263g
81%
Sodium
49mg
1809mg
77%
Copper
0.634mg
0.034mg
67%
Calcium
10mg
662mg
65%
Vitamin B5
4.774mg
1.731mg
61%
Vitamin B3
8.435mg
0.734mg
48%
Zinc
6.72mg
2.08mg
42%
Fats
4.4g
30.64g
40%
Vitamin B6
0.57mg
0.124mg
34%
Folate
163µg
49µg
29%
Vitamin C
23.6mg
0mg
26%
Phosphorus
241mg
392mg
22%
Monounsaturated fat
0.63g
8.474g
20%
Vitamin B1
0.258mg
0.04mg
18%
Manganese
0.3mg
0.03mg
12%
Calories
165kcal
369kcal
10%
Protein
26.02g
21.54g
9%
Magnesium
14mg
30mg
4%
Potassium
150mg
91mg
2%
Polyunsaturated fat
1.05g
1.32g
2%
Carbs
3.76g
2g
1%
Protein per 100 calories
16g
5.8g
N/A
Calories per 10 g protein
63kcal
171kcal
N/A
Weight per 100 calories
61g
27g
N/A
Unsaturated / Saturated Fat ratio
1.2
0.51
N/A
Net carbs
3.76g
2g
N/A
Tryptophan
0.366mg
0.303mg
0%
Threonine
1.107mg
0.965mg
0%
Isoleucine
1.32mg
1.217mg
0%
Leucine
2.319mg
2.114mg
0%
Lysine
2.007mg
1.848mg
0%
Methionine
0.645mg
0.558mg
0%
Phenylalanine
1.274mg
1.023mg
0%
Valine
1.607mg
1.614mg
0%
Histidine
0.708mg
0.602mg
0%
Omega-3 - DHA
0.03g
N/A
Omega-3 - DPA
0.04g
N/A
Macronutrient Comparison
Macronutrient breakdown side-by-side comparison
3
26%
4%
4%
64%
Protein:
26.02 g
Fats:
4.4 g
Carbs:
3.76 g
Water:
64.32 g
Other:
1.5 g
2
22%
31%
2%
39%
6%
Protein:
21.54 g
Fats:
30.64 g
Carbs:
2 g
Water:
39.38 g
Other:
6.44 g
Contains
more
Protein Protein
+20.8%
Contains
more
Carbs Carbs
+88%
Contains
more
Water Water
+63.3%
Contains
more
Fats Fats
+596.4%
Contains
more
Other Other
+329.3%
Fat Type Comparison
Fat type breakdown side-by-side comparison
1
46%
20%
34%
Saturated fat:
Sat. Fat
1.41 g
Monounsaturated fat:
Mono. Fat
0.63 g
Polyunsaturated fat:
Poly. Fat
1.05 g
2
66%
29%
5%
Saturated fat:
Sat. Fat
19.263 g
Monounsaturated fat:
Mono. Fat
8.474 g
Polyunsaturated fat:
Poly. Fat
1.32 g
Contains
less
Sat. Fat Saturated fat
-92.7%
Contains
more
Mono. Fat Monounsaturated fat
+1245.1%
Contains
more
Poly. Fat Polyunsaturated fat
+25.7%