
Potato vs. Rice — In-Depth Nutrition Comparison
Compare
How are potatoes and rice different?
- Potatoes are higher in vitamin B6, potassium, vitamin C, fiber, and copper; however, rice is richer in selenium, manganese, vitamin B1, and folate.
- Daily need coverage for vitamin B6 for potatoes is 17% higher.
- Rice has a lower glycemic index (60) than potatoes (86).
Potatoes, baked, flesh, and skin, without salt and Rice, white, long-grain, regular, enriched, cooked are the varieties used in this article.
Infographic
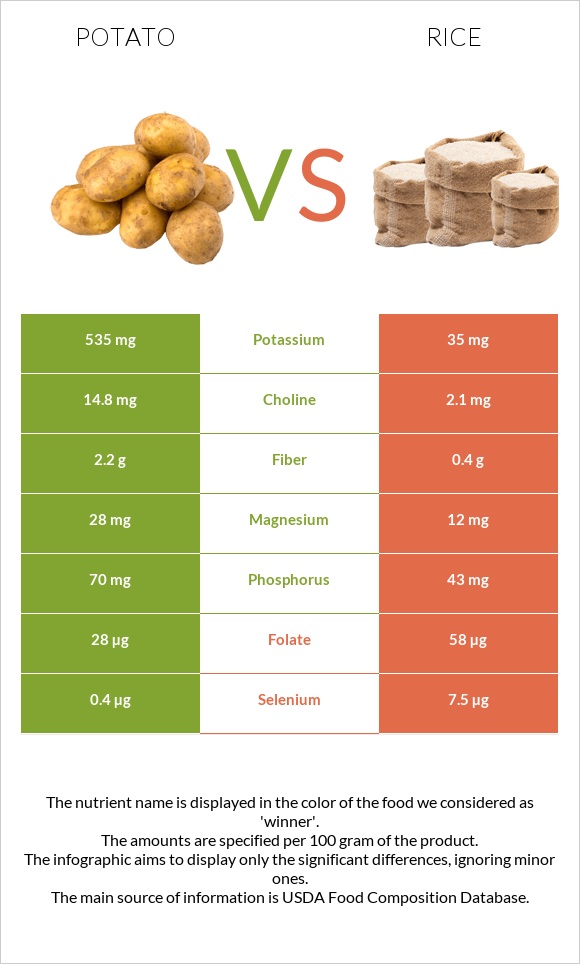
Infographic link
Mineral Comparison
The mineral comparison score is based on which food has a more favorable amount of each mineral. The �coverage� charts below show how much of the daily mineral needs are covered by the selected amount of each food.
| Contains more MagnesiumMagnesium | +133.3% |
| Contains more CalciumCalcium | +50% |
| Contains more PotassiumPotassium | +1428.6% |
| Contains more CopperCopper | +71% |
| Contains more PhosphorusPhosphorus | +62.8% |
| Contains more IronIron | +11.1% |
| Contains more ZincZinc | +36.1% |
| Contains less SodiumSodium | -90% |
| Contains more ManganeseManganese | +115.5% |
| Contains more SeleniumSelenium | +1775% |
Vitamin Comparison
The vitamin comparison score is based on the number of vitamins in which one food is richer than the other. The �coverage� charts below show how much of the daily vitamin needs are covered by the selected amount of each food.
| Contains more Vitamin CVitamin C | +∞% |
| Contains more Vitamin AVitamin A | +∞% |
| Contains more Vitamin B2Vitamin B2 | +269.2% |
| Contains more Vitamin B6Vitamin B6 | +234.4% |
| Contains more Vitamin KVitamin K | +∞% |
| Contains more Vitamin B1Vitamin B1 | +154.7% |
| Contains more FolateFolate | +107.1% |
All nutrients comparison - raw data values
| Nutrient |  |
 |
DV% diff. |
| Vitamin B6 | 0.311mg | 0.093mg | 17% |
| Potassium | 535mg | 35mg | 15% |
| Selenium | 0.4µg | 7.5µg | 13% |
| Vitamin C | 9.6mg | 0mg | 11% |
| Manganese | 0.219mg | 0.472mg | 11% |
| Vitamin B1 | 0.064mg | 0.163mg | 8% |
| Folate | 28µg | 58µg | 8% |
| Fiber | 2.2g | 0.4g | 7% |
| Starch | 17.27g | 7% | |
| Copper | 0.118mg | 0.069mg | 5% |
| Magnesium | 28mg | 12mg | 4% |
| Phosphorus | 70mg | 43mg | 4% |
| Vitamin B2 | 0.048mg | 0.013mg | 3% |
| Calories | 93kcal | 130kcal | 2% |
| Carbs | 21.15g | 28.17g | 2% |
| Iron | 1.08mg | 1.2mg | 2% |
| Vitamin K | 2µg | 0µg | 2% |
| Choline | 14.8mg | 2.1mg | 2% |
| Calcium | 15mg | 10mg | 1% |
| Zinc | 0.36mg | 0.49mg | 1% |
| Protein | 2.5g | 2.69g | 0% |
| Protein per 100 calories | 2.7g | 2.1g | N/A |
| Calories per 10 g protein | 372kcal | 483kcal | N/A |
| Weight per 100 calories | 108g | 77g | N/A |
| Fats | 0.13g | 0.28g | 0% |
| Net carbs | 18.95g | 27.77g | N/A |
| Sugar | 1.18g | 0.05g | N/A |
| Sodium | 10mg | 1mg | 0% |
| Vitamin A | 1µg | 0µg | 0% |
| Vitamin E | 0.04mg | 0.04mg | 0% |
| Vitamin B3 | 1.41mg | 1.476mg | 0% |
| Vitamin B5 | 0.376mg | 0.39mg | 0% |
| Saturated fat | 0.034g | 0.077g | 0% |
| Monounsaturated fat | 0.003g | 0.088g | 0% |
| Polyunsaturated fat | 0.057g | 0.076g | 0% |
| Tryptophan | 0.025mg | 0.031mg | 0% |
| Threonine | 0.081mg | 0.096mg | 0% |
| Isoleucine | 0.08mg | 0.116mg | 0% |
| Leucine | 0.119mg | 0.222mg | 0% |
| Lysine | 0.13mg | 0.097mg | 0% |
| Methionine | 0.038mg | 0.063mg | 0% |
| Phenylalanine | 0.099mg | 0.144mg | 0% |
| Valine | 0.125mg | 0.164mg | 0% |
| Histidine | 0.042mg | 0.063mg | 0% |
| Fructose | 0.34g | 0% |
Macronutrient Comparison
Macronutrient breakdown side-by-side comparison
| Contains more FatsFats | +115.4% |
| Contains more CarbsCarbs | +33.2% |
~equal in
Protein
~2.69g
~equal in
Water
~68.44g
Fat Type Comparison
Fat type breakdown side-by-side comparison
| Contains less Sat. FatSaturated fat | -55.8% |
| Contains more Mono. FatMonounsaturated fat | +2833.3% |
| Contains more Poly. FatPolyunsaturated fat | +33.3% |


