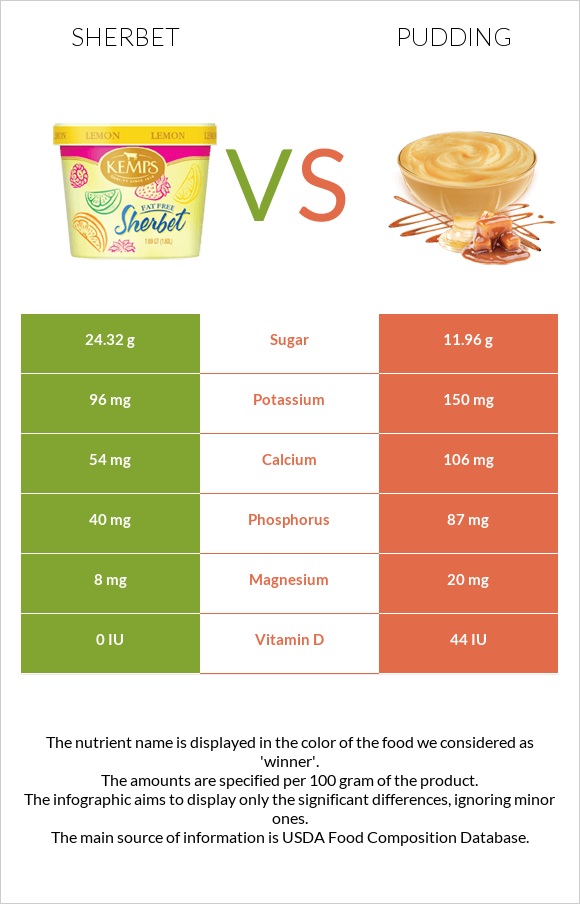
What are the main differences between sherbet and pudding? Pudding has more copper, vitamin B12, phosphorus, vitamin D* and calcium than sherbet. Pudding has 2 times less sugar than sherbet. Sherbet has 24.32g of sugar, while pudding has 11.96g. Sherbet has a higher glycemic index (59) than pudding (47). We used Sherbet, orange and Puddings, chocolate, dry mix, regular, prepared with whole milk types in this comparison.
Infographic
Mineral Comparison
Mineral comparison score is based on the number of minerals by which one or the other food is richer. The "coverage" charts below show how much of the daily needs can be covered by 300 grams of the food.
1
100 g
300 g
1 bar (2.75 fl oz) - 66g 0.5 cup (4 fl oz) - 74g
Magnesium
Magnesium
Calcium
Calcium
Potassium
Potassium
Iron
Iron
Copper
Copper
Zinc
Zinc
Phosphorus
Phosphorus
Sodium
Sodium
Manganese
Manganese
Selenium
Selenium
5.7%
16%
8.5%
5.3%
9.3%
13%
17%
6%
1.4%
8.2%
8
100 g
300 g
0.5 cup - 142g 1 package yield (2 cups) - 570g
Magnesium
Magnesium
Calcium
Calcium
Potassium
Potassium
Iron
Iron
Copper
Copper
Zinc
Zinc
Phosphorus
Phosphorus
Sodium
Sodium
Manganese
Manganese
Selenium
Selenium
14%
32%
13%
13%
37%
13%
37%
13%
13%
20%
Vitamin Comparison
Vitamin comparison score is based on the number of vitamins by which one or the other food is richer. The "coverage" charts below show how much of the daily needs can be covered by 300 grams of the food.
1
100 g
300 g
1 bar (2.75 fl oz) - 66g 0.5 cup (4 fl oz) - 74g
Vitamin C
Vit. C
Vitamin D
Vit. D
Vitamin A
Vit. A
Vitamin E
Vit. E
Vitamin B1
Vit. B1
Vitamin B2
Vit. B2
Vitamin B3
Vit. B3
Vitamin B5
Vit. B5
Vitamin B6
Vit. B6
Vitamin B12
Vit. B12
Vitamin K
Vit. K
Folate
Folate
7.7%
0%
4%
0.2%
6.8%
22%
1.2%
13%
5.3%
16%
0%
3%
10
100 g
300 g
0.5 cup - 142g 1 package yield (2 cups) - 570g
Vitamin C
Vit. C
Vitamin D
Vit. D
Vitamin A
Vit. A
Vitamin E
Vit. E
Vitamin B1
Vit. B1
Vitamin B2
Vit. B2
Vitamin B3
Vit. B3
Vitamin B5
Vit. B5
Vitamin B6
Vit. B6
Vitamin B12
Vit. B12
Vitamin K
Vit. K
Folate
Folate
0%
17%
13%
1.2%
9.5%
36%
2.5%
20%
6.9%
39%
0.75%
3%
All nutrients comparison - raw data values
Nutrient
DV% diff.
Copper
0.028mg
0.111mg
9%
Vitamin B12
0.13µg
0.31µg
8%
Phosphorus
40mg
87mg
7%
Vitamin D*
0 IU
44 IU
6%
Vitamin D
0µg
1.1µg
6%
Calcium
54mg
106mg
5%
Vitamin B2
0.097mg
0.157mg
5%
Protein
1.1g
3.16g
4%
Carbs
30.4g
19.64g
4%
Manganese
0.011mg
0.097mg
4%
Selenium
1.5µg
3.7µg
4%
Vitamin C
2.3mg
0mg
3%
Cholesterol
1mg
9mg
3%
Magnesium
8mg
20mg
3%
Iron
0.14mg
0.34mg
3%
Vitamin A
12µg
39µg
3%
Saturated fat
1.16g
1.81g
3%
Fats
2g
3.15g
2%
Potassium
96mg
150mg
2%
Fiber
1.3g
0.8g
2%
Sodium
46mg
98mg
2%
Vitamin B5
0.224mg
0.326mg
2%
Calories
144kcal
120kcal
1%
Vitamin B1
0.027mg
0.038mg
1%
Vitamin B6
0.023mg
0.03mg
1%
Choline
7.7mg
11.3mg
1%
Monounsaturated fat
0.53g
0.819g
1%
Polyunsaturated fat
0.08g
0.18g
1%
Caffeine
0mg
2mg
1%
Protein per 100 calories
0.76g
2.6g
N/A
Calories per 10 g protein
1309kcal
380kcal
N/A
Weight per 100 calories
69g
83g
N/A
Unsaturated / Saturated Fat ratio
0.53
0.55
N/A
Net carbs
29.1g
18.84g
N/A
Sugar
24.32g
11.96g
N/A
Zinc
0.48mg
0.48mg
0%
Vitamin E
0.01mg
0.06mg
0%
Vitamin B3
0.063mg
0.133mg
0%
Vitamin K
0µg
0.3µg
0%
Folate
4µg
4µg
0%
Macronutrient Comparison
Macronutrient breakdown side-by-side comparison
1
2%
30%
66%
Protein:
1.1 g
Fats:
2 g
Carbs:
30.4 g
Water:
66.1 g
Other:
0.4 g
4
3%
3%
20%
73%
Protein:
3.16 g
Fats:
3.15 g
Carbs:
19.64 g
Water:
73.13 g
Other:
0.92 g
Contains
more
Carbs Carbs
+54.8%
Contains
more
Protein Protein
+187.3%
Contains
more
Fats Fats
+57.5%
Contains
more
Water Water
+10.6%
Contains
more
Other Other
+130%
Fat Type Comparison
Fat type breakdown side-by-side comparison
1
66%
30%
5%
Saturated fat:
Sat. Fat
1.16 g
Monounsaturated fat:
Mono. Fat
0.53 g
Polyunsaturated fat:
Poly. Fat
0.08 g
2
64%
29%
6%
Saturated fat:
Sat. Fat
1.81 g
Monounsaturated fat:
Mono. Fat
0.819 g
Polyunsaturated fat:
Poly. Fat
0.18 g
Contains
less
Sat. Fat Saturated fat
-35.9%
Contains
more
Mono. Fat Monounsaturated fat
+54.5%
Contains
more
Poly. Fat Polyunsaturated fat
+125%