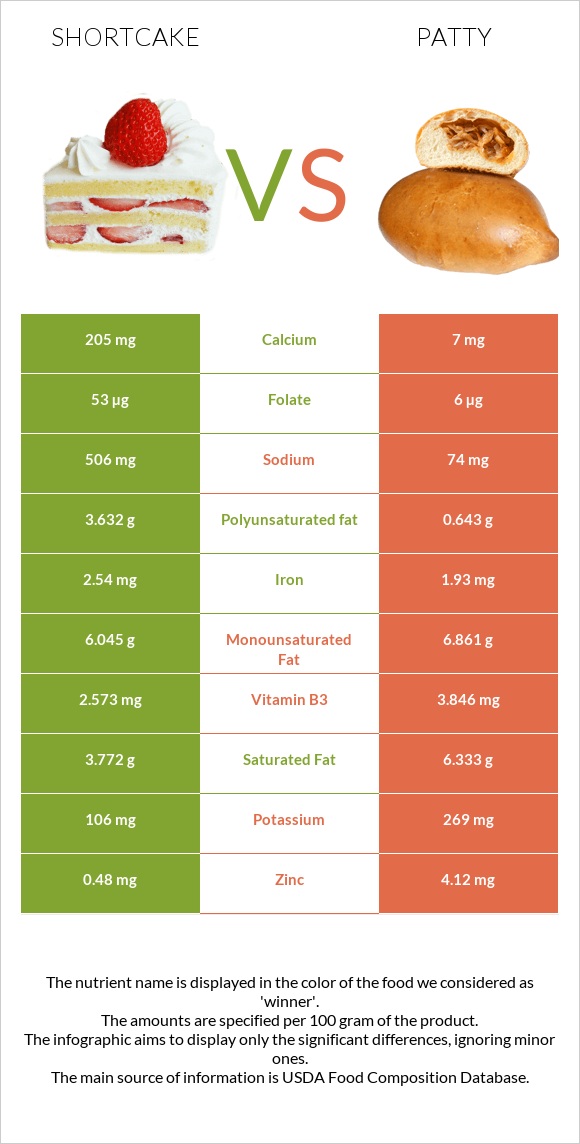
Summary of differences between shortcake and patty Shortcake has more vitamin B1, calcium, manganese, and folate; however, patty is higher in vitamin B12, zinc, and vitamin B6. Patty covers your daily need for vitamin B12, 83% more than shortcake. Shortcake has 29 times more calcium than patty. While shortcake has 205mg of calcium, patty has only 7mg. Patty has less sodium. These are the specific foods used in this comparison Cake, shortcake, biscuit-type, prepared from recipe and USDA Commodity, beef, patties (100%), frozen, raw .
Infographic
Mineral Comparison
Mineral comparison score is based on the number of minerals by which one or the other food is richer. The "coverage" charts below show how much of the daily needs can be covered by 300 grams of the food.
4
100 g
300 g
1 oz - 28.35g
Magnesium
Magnesium
Calcium
Calcium
Potassium
Potassium
Iron
Iron
Copper
Copper
Zinc
Zinc
Phosphorus
Phosphorus
Sodium
Sodium
Manganese
Manganese
Selenium
Selenium
11%
62%
9.4%
95%
25%
13%
61%
66%
43%
93%
4
100 g
300 g
3 oz - 85g
Magnesium
Magnesium
Calcium
Calcium
Potassium
Potassium
Iron
Iron
Copper
Copper
Zinc
Zinc
Phosphorus
Phosphorus
Sodium
Sodium
Manganese
Manganese
Selenium
Selenium
13%
2.1%
24%
72%
24%
112%
62%
9.7%
2.2%
81%
Vitamin Comparison
Vitamin comparison score is based on the number of vitamins by which one or the other food is richer. The "coverage" charts below show how much of the daily needs can be covered by 300 grams of the food.
5
100 g
300 g
1 oz - 28.35g
Vitamin C
Vit. C
Vitamin D
Vit. D
Vitamin A
Vit. A
Vitamin E
Vit. E
Vitamin B1
Vit. B1
Vitamin B2
Vit. B2
Vitamin B3
Vit. B3
Vitamin B5
Vit. B5
Vitamin B6
Vit. B6
Vitamin B12
Vit. B12
Vitamin K
Vit. K
Folate
Folate
0.67%
0%
6%
0%
78%
63%
48%
15%
6.9%
8.8%
0%
40%
4
100 g
300 g
3 oz - 85g
Vitamin C
Vit. C
Vitamin D
Vit. D
Vitamin A
Vit. A
Vitamin E
Vit. E
Vitamin B1
Vit. B1
Vitamin B2
Vit. B2
Vitamin B3
Vit. B3
Vitamin B5
Vit. B5
Vitamin B6
Vit. B6
Vitamin B12
Vit. B12
Vitamin K
Vit. K
Folate
Folate
0%
0%
0%
0%
11%
37%
72%
19%
49%
256%
0%
4.5%
All nutrients comparison - raw data values
Nutrient
DV% diff.
Vitamin B12
0.07µg
2.05µg
83%
Zinc
0.48mg
4.12mg
33%
Vitamin B1
0.311mg
0.043mg
22%
Calcium
205mg
7mg
20%
Polyunsaturated fat
3.632g
0.643g
20%
Sodium
506mg
74mg
19%
Protein
6.1g
14.63g
17%
Cholesterol
3mg
53mg
17%
Carbs
48.5g
0g
16%
Manganese
0.33mg
0.017mg
14%
Vitamin B6
0.03mg
0.214mg
14%
Folate
53µg
6µg
12%
Saturated fat
3.772g
6.333g
12%
Vitamin B2
0.272mg
0.16mg
9%
Iron
2.54mg
1.93mg
8%
Vitamin B3
2.573mg
3.846mg
8%
Calories
346kcal
204kcal
7%
Potassium
106mg
269mg
5%
Selenium
17µg
14.8µg
4%
Fats
14.2g
15.69g
2%
Vitamin A
18µg
0µg
2%
Monounsaturated fat
6.045g
6.861g
2%
Vitamin B5
0.248mg
0.309mg
1%
Protein per 100 calories
1.8g
7.2g
N/A
Calories per 10 g protein
567kcal
139kcal
N/A
Weight per 100 calories
29g
49g
N/A
Unsaturated / Saturated Fat ratio
2.6
1.2
N/A
Vitamin C
0.2mg
0mg
0%
Net carbs
48.5g
0g
N/A
Magnesium
16mg
18mg
0%
Copper
0.076mg
0.073mg
0%
Phosphorus
143mg
145mg
0%
Tryptophan
0.076mg
0%
Threonine
0.184mg
0%
Isoleucine
0.238mg
0%
Leucine
0.449mg
0%
Lysine
0.197mg
0%
Methionine
0.115mg
0%
Phenylalanine
0.302mg
0%
Valine
0.273mg
0%
Histidine
0.14mg
0%
Macronutrient Comparison
Macronutrient breakdown side-by-side comparison
1
6%
14%
49%
28%
3%
Protein:
6.1 g
Fats:
14.2 g
Carbs:
48.5 g
Water:
28.4 g
Other:
2.8 g
4
15%
16%
65%
5%
Protein:
14.63 g
Fats:
15.69 g
Carbs:
0 g
Water:
64.72 g
Other:
4.96 g
Contains
more
Carbs Carbs
+∞%
Contains
more
Protein Protein
+139.8%
Contains
more
Fats Fats
+10.5%
Contains
more
Water Water
+127.9%
Contains
more
Other Other
+77.1%
Fat Type Comparison
Fat type breakdown side-by-side comparison
2
28%
45%
27%
Saturated fat:
Sat. Fat
3.772 g
Monounsaturated fat:
Mono. Fat
6.045 g
Polyunsaturated fat:
Poly. Fat
3.632 g
1
46%
50%
5%
Saturated fat:
Sat. Fat
6.333 g
Monounsaturated fat:
Mono. Fat
6.861 g
Polyunsaturated fat:
Poly. Fat
0.643 g
Contains
less
Sat. Fat Saturated fat
-40.4%
Contains
more
Poly. Fat Polyunsaturated fat
+464.9%
Contains
more
Mono. Fat Monounsaturated fat
+13.5%