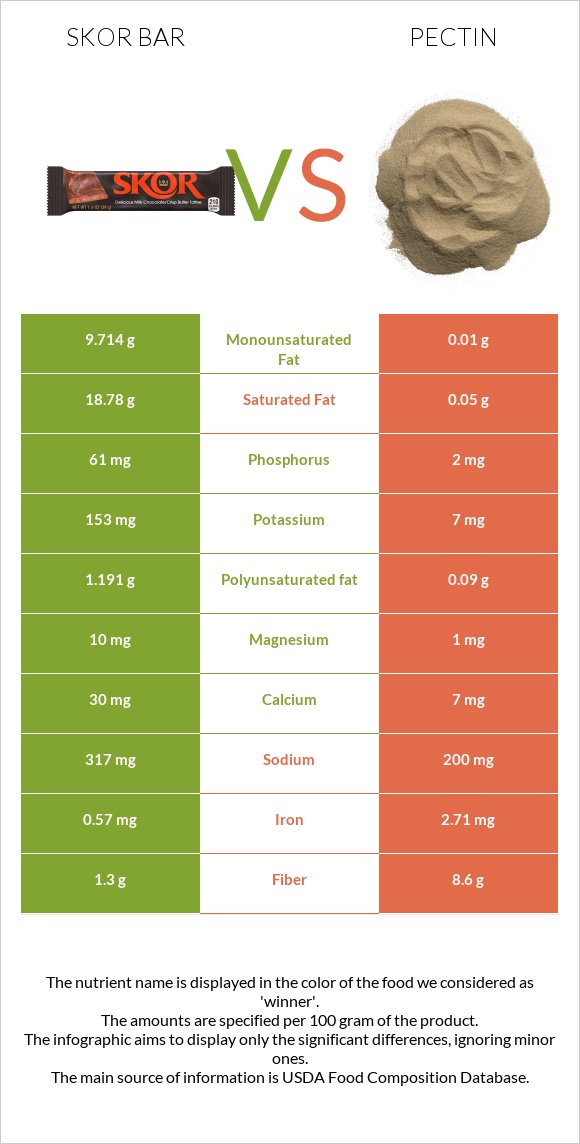
What are the main differences between skor bar and pectin? Skor bar is richer in vitamin B12 and phosphorus, yet pectin is richer in copper, fiber, and iron. Skor bar's daily need coverage for saturated fat is 94% higher. We used Candies, HERSHEY'S SKOR Toffee Bar and Pectin, unsweetened, dry mix types in this comparison.
Infographic
Mineral Comparison
Mineral comparison score is based on the number of minerals by which one or the other food is richer. The "coverage" charts below show how much of the daily needs can be covered by 300 grams of the food.
4
100 g
300 g
1 bar 1.4 oz - 39g
Magnesium
Magnesium
Calcium
Calcium
Potassium
Potassium
Iron
Iron
Copper
Copper
Zinc
Zinc
Phosphorus
Phosphorus
Sodium
Sodium
Manganese
Manganese
Selenium
Selenium
7.1%
9%
14%
21%
13%
4.6%
26%
41%
0%
0%
5
100 g
300 g
1 package (1.75 oz) - 50g
Magnesium
Magnesium
Calcium
Calcium
Potassium
Potassium
Iron
Iron
Copper
Copper
Zinc
Zinc
Phosphorus
Phosphorus
Sodium
Sodium
Manganese
Manganese
Selenium
Selenium
0.71%
2.1%
0.62%
102%
140%
13%
0.86%
26%
9.1%
0%
Vitamin Comparison
Vitamin comparison score is based on the number of vitamins by which one or the other food is richer. The "coverage" charts below show how much of the daily needs can be covered by 300 grams of the food.
11
100 g
300 g
1 bar 1.4 oz - 39g
Vitamin C
Vit. C
Vitamin D
Vit. D
Vitamin A
Vit. A
Vitamin E
Vit. E
Vitamin B1
Vit. B1
Vitamin B2
Vit. B2
Vitamin B3
Vit. B3
Vitamin B5
Vit. B5
Vitamin B6
Vit. B6
Vitamin B12
Vit. B12
Vitamin K
Vit. K
Folate
Folate
1.7%
1.5%
20%
12%
5%
23%
2.4%
2.4%
5.1%
26%
22%
1.5%
1
100 g
300 g
1 package (1.75 oz) - 50g
Vitamin C
Vit. C
Vitamin D
Vit. D
Vitamin A
Vit. A
Vitamin E
Vit. E
Vitamin B1
Vit. B1
Vitamin B2
Vit. B2
Vitamin B3
Vit. B3
Vitamin B5
Vit. B5
Vitamin B6
Vit. B6
Vitamin B12
Vit. B12
Vitamin K
Vit. K
Folate
Folate
0%
0%
0%
0%
2%
14%
0.09%
6.6%
2.3%
0%
0%
0.75%
All nutrients comparison - raw data values
Nutrient
DV% diff.
Saturated fat
18.78g
0.05g
85%
Fats
30.37g
0.3g
46%
Copper
0.04mg
0.42mg
42%
Fiber
1.3g
8.6g
29%
Iron
0.57mg
2.71mg
27%
Monounsaturated fat
9.714g
0.01g
24%
Cholesterol
53mg
0mg
18%
Calories
541kcal
325kcal
11%
Carbs
63.73g
90.4g
9%
Vitamin B12
0.21µg
0µg
9%
Phosphorus
61mg
2mg
8%
Vitamin A
61µg
0µg
7%
Vitamin K
8.6µg
7%
Polyunsaturated fat
1.191g
0.09g
7%
Protein
3.13g
0.3g
6%
Sodium
317mg
200mg
5%
Potassium
153mg
7mg
4%
Vitamin E
0.58mg
4%
Zinc
0.17mg
0.47mg
3%
Manganese
0mg
0.07mg
3%
Vitamin B2
0.1mg
0.06mg
3%
Caffeine
10mg
3%
Magnesium
10mg
1mg
2%
Calcium
30mg
7mg
2%
Vitamin C
0.5mg
0mg
1%
Vitamin D
0.1µg
1%
Vitamin B1
0.02mg
0.008mg
1%
Vitamin B3
0.13mg
0.005mg
1%
Vitamin B5
0.04mg
0.11mg
1%
Vitamin B6
0.022mg
0.01mg
1%
Choline
3.1mg
1%
Weight per 100 calories
18g
31g
N/A
Unsaturated / Saturated Fat ratio
0.58
2
N/A
Net carbs
62.43g
81.8g
N/A
Vitamin D*
3 IU
0%
Sugar
59.89g
N/A
Folate
2µg
1µg
0%
Macronutrient Comparison
Macronutrient breakdown side-by-side comparison
3
3%
30%
64%
Protein:
3.13 g
Fats:
30.37 g
Carbs:
63.73 g
Water:
1.57 g
Other:
1.2 g
2
90%
9%
Protein:
0.3 g
Fats:
0.3 g
Carbs:
90.4 g
Water:
8.7 g
Other:
0.3 g
Contains
more
Protein Protein
+943.3%
Contains
more
Fats Fats
+10023.3%
Contains
more
Other Other
+300%
Contains
more
Carbs Carbs
+41.8%
Contains
more
Water Water
+454.1%
Fat Type Comparison
Fat type breakdown side-by-side comparison
2
63%
33%
4%
Saturated fat:
Sat. Fat
18.78 g
Monounsaturated fat:
Mono. Fat
9.714 g
Polyunsaturated fat:
Poly. Fat
1.191 g
1
33%
7%
60%
Saturated fat:
Sat. Fat
0.05 g
Monounsaturated fat:
Mono. Fat
0.01 g
Polyunsaturated fat:
Poly. Fat
0.09 g
Contains
more
Mono. Fat Monounsaturated fat
+97040%
Contains
more
Poly. Fat Polyunsaturated fat
+1223.3%
Contains
less
Sat. Fat Saturated fat
-99.7%