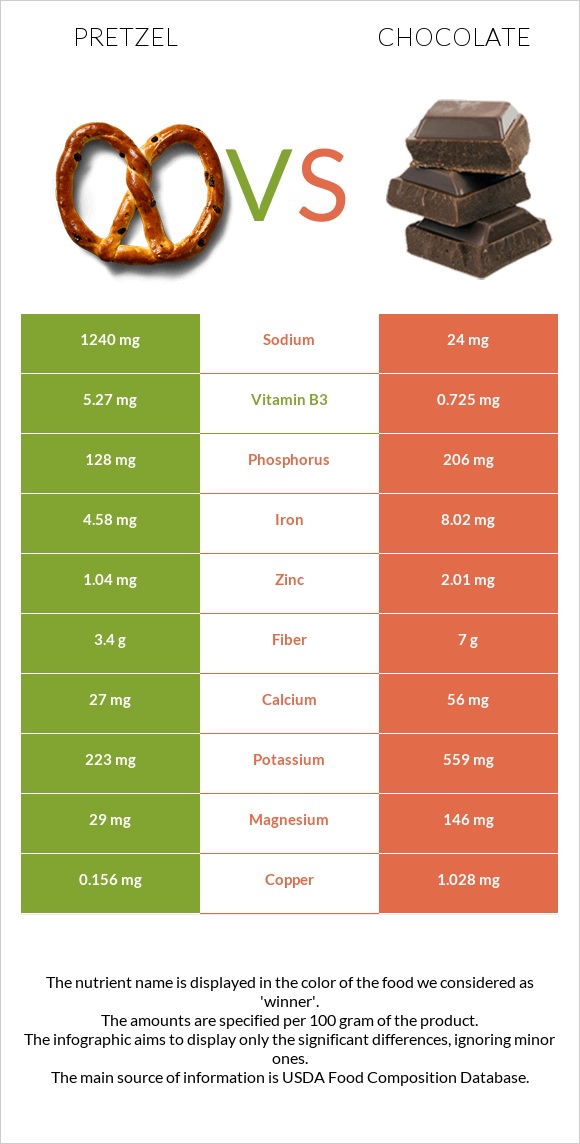
How are pretzel and chocolate different? Pretzel is higher in vitamin B1, vitamin B3, and vitamin B2; however, chocolate is richer in copper, iron, magnesium, manganese, and fiber. Daily need coverage for copper for chocolate is 97% higher. Pretzel contains 52 times more sodium than chocolate. While pretzel contains 1240mg of sodium, chocolate contains only 24mg. Chocolate has a lower glycemic index (23) than pretzel (83). Snacks, pretzels, hard, plain, salted and Chocolate, dark, 45- 59% cacao solids are the varieties used in this article.
Infographic
Mineral Comparison
Mineral comparison score is based on the number of minerals by which one or the other food is richer. The "coverage" charts below show how much of the daily needs can be covered by 300 grams of the food.
1
100 g
300 g
1 oz - 28.35g 10 twists - 60g
Magnesium
Magnesium
Calcium
Calcium
Potassium
Potassium
Iron
Iron
Copper
Copper
Zinc
Zinc
Phosphorus
Phosphorus
Sodium
Sodium
Manganese
Manganese
Selenium
Selenium
21%
8.1%
20%
172%
52%
28%
55%
162%
132%
24%
9
100 g
300 g
1 oz - 28.35g 1 bar - 162g
Magnesium
Magnesium
Calcium
Calcium
Potassium
Potassium
Iron
Iron
Copper
Copper
Zinc
Zinc
Phosphorus
Phosphorus
Sodium
Sodium
Manganese
Manganese
Selenium
Selenium
104%
17%
49%
301%
343%
55%
88%
3.1%
185%
16%
Vitamin Comparison
Vitamin comparison score is based on the number of vitamins by which one or the other food is richer. The "coverage" charts below show how much of the daily needs can be covered by 300 grams of the food.
6
100 g
300 g
1 oz - 28.35g 10 twists - 60g
Vitamin C
Vit. C
Vitamin D
Vit. D
Vitamin A
Vit. A
Vitamin E
Vit. E
Vitamin B1
Vit. B1
Vitamin B2
Vit. B2
Vitamin B3
Vit. B3
Vitamin B5
Vit. B5
Vitamin B6
Vit. B6
Vitamin B12
Vit. B12
Vitamin K
Vit. K
Folate
Folate
7%
0%
0%
9.4%
106%
77%
99%
19%
17%
0%
7%
125%
4
100 g
300 g
1 oz - 28.35g 1 bar - 162g
Vitamin C
Vit. C
Vitamin D
Vit. D
Vitamin A
Vit. A
Vitamin E
Vit. E
Vitamin B1
Vit. B1
Vitamin B2
Vit. B2
Vitamin B3
Vit. B3
Vitamin B5
Vit. B5
Vitamin B6
Vit. B6
Vitamin B12
Vit. B12
Vitamin K
Vit. K
Folate
Folate
0%
0%
0.67%
11%
6.3%
12%
14%
18%
9.7%
29%
20%
0%
All nutrients comparison - raw data values
Nutrient
DV% diff.
Copper
0.156mg
1.028mg
97%
Saturated fat
0.391g
18.519g
82%
Sodium
1240mg
24mg
53%
Fats
2.93g
31.28g
44%
Iron
4.58mg
8.02mg
43%
Folate
166µg
42%
Vitamin B1
0.424mg
0.025mg
33%
Starch
72.58g
30%
Magnesium
29mg
146mg
28%
Vitamin B3
5.27mg
0.725mg
28%
Vitamin B2
0.332mg
0.05mg
22%
Monounsaturated fat
0.727g
9.54g
22%
Manganese
1.015mg
1.419mg
18%
Fiber
3.4g
7g
14%
Phosphorus
128mg
206mg
11%
Caffeine
0mg
43mg
11%
Protein
10.04g
4.88g
10%
Potassium
223mg
559mg
10%
Vitamin B12
0µg
0.23µg
10%
Zinc
1.04mg
2.01mg
9%
Calories
384kcal
546kcal
8%
Carbs
80.39g
61.17g
6%
Choline
29.5mg
5%
Vitamin K
2.8µg
8.1µg
4%
Cholesterol
0mg
8mg
3%
Calcium
27mg
56mg
3%
Selenium
4.4µg
3µg
3%
Vitamin C
2.1mg
2%
Vitamin B6
0.074mg
0.042mg
2%
Vitamin B5
0.322mg
0.297mg
1%
Polyunsaturated fat
1.291g
1.092g
1%
Protein per 100 calories
2.6g
0.89g
N/A
Calories per 10 g protein
382kcal
1119kcal
N/A
Weight per 100 calories
26g
18g
N/A
Unsaturated / Saturated Fat ratio
5.2
0.57
N/A
Net carbs
76.99g
54.17g
N/A
Sugar
2.21g
47.9g
N/A
Vitamin A
0µg
2µg
0%
Vitamin E
0.47mg
0.54mg
0%
Trans fat
0.004g
0.112g
N/A
Tryptophan
0.097mg
0%
Threonine
0.25mg
0%
Isoleucine
0.407mg
0%
Leucine
0.757mg
0%
Lysine
0.257mg
0%
Methionine
0.177mg
0%
Phenylalanine
0.52mg
0%
Valine
0.48mg
0%
Histidine
0.22mg
0%
Fructose
0.31g
0g
0%
Omega-3 - EPA
0g
0.001g
N/A
Omega-3 - ALA
0.063g
0.085g
N/A
Omega-6 - Gamma-linoleic acid
0.001g
0g
N/A
Omega-6 - Eicosadienoic acid
0g
0.001g
N/A
Omega-6 - Linoleic acid
1.223g
0.947g
N/A
Macronutrient Comparison
Macronutrient breakdown side-by-side comparison
4
10%
3%
80%
3%
4%
Protein:
10.04 g
Fats:
2.93 g
Carbs:
80.39 g
Water:
3.13 g
Other:
3.51 g
1
5%
31%
61%
2%
Protein:
4.88 g
Fats:
31.28 g
Carbs:
61.17 g
Water:
0.97 g
Other:
1.7 g
Contains
more
Protein Protein
+105.7%
Contains
more
Carbs Carbs
+31.4%
Contains
more
Water Water
+222.7%
Contains
more
Other Other
+106.5%
Contains
more
Fats Fats
+967.6%
Fat Type Comparison
Fat type breakdown side-by-side comparison
2
16%
30%
54%
Saturated fat:
Sat. Fat
0.391 g
Monounsaturated fat:
Mono. Fat
0.727 g
Polyunsaturated fat:
Poly. Fat
1.291 g
1
64%
33%
4%
Saturated fat:
Sat. Fat
18.519 g
Monounsaturated fat:
Mono. Fat
9.54 g
Polyunsaturated fat:
Poly. Fat
1.092 g
Contains
less
Sat. Fat Saturated fat
-97.9%
Contains
more
Poly. Fat Polyunsaturated fat
+18.2%
Contains
more
Mono. Fat Monounsaturated fat
+1212.2%
Carbohydrate type comparison
Carbohydrate type breakdown side-by-side comparison
4
97%
Starch:
72.58 g
Sucrose:
0 g
Glucose:
0.69 g
Fructose:
0.31 g
Lactose:
0 g
Maltose:
1.11 g
Galactose:
0 g
2
97%
3%
Starch:
0 g
Sucrose:
46.25 g
Glucose:
0 g
Fructose:
0 g
Lactose:
1.65 g
Maltose:
0 g
Galactose:
0 g
Contains
more
Starch Starch
+∞%
Contains
more
Glucose Glucose
+∞%
Contains
more
Fructose Fructose
+∞%
Contains
more
Maltose Maltose
+∞%
Contains
more
Sucrose Sucrose
+∞%
Contains
more
Lactose Lactose
+∞%