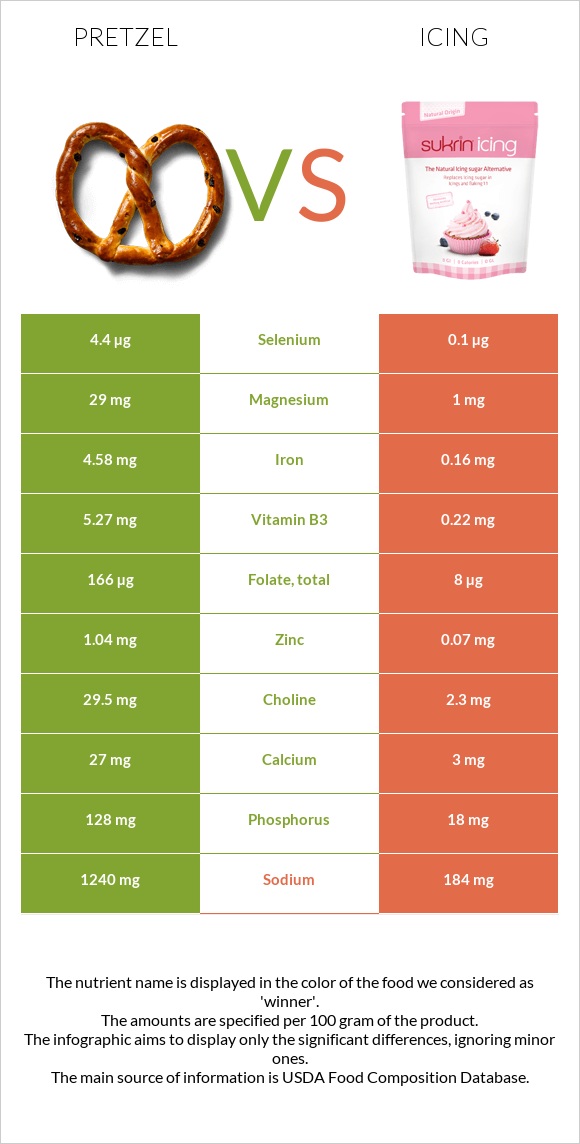
What are the differences between pretzel and icing? Pretzel is richer than icing in iron, manganese, folate, vitamin B1, vitamin B3, copper, phosphorus, and fiber. Pretzel's daily need coverage for iron is 55% more. The amount of sodium in icing is lower. The glycemic index of icing is lower. We used Snacks, pretzels, hard, plain, salted and Frostings, vanilla, creamy, ready-to-eat types in this article.
Infographic
Mineral Comparison
Mineral comparison score is based on the number of minerals by which one or the other food is richer. The "coverage" charts below show how much of the daily needs can be covered by 300 grams of the food.
9
100 g
300 g
1 oz - 28.35g 10 twists - 60g
Magnesium
Magnesium
Calcium
Calcium
Potassium
Potassium
Iron
Iron
Copper
Copper
Zinc
Zinc
Phosphorus
Phosphorus
Sodium
Sodium
Manganese
Manganese
Selenium
Selenium
21%
8.1%
20%
172%
52%
28%
55%
162%
132%
24%
1
100 g
300 g
2 tbsp creamy - 33g 0.083 package - 38g 1 package (16 oz) - 462g
Magnesium
Magnesium
Calcium
Calcium
Potassium
Potassium
Iron
Iron
Copper
Copper
Zinc
Zinc
Phosphorus
Phosphorus
Sodium
Sodium
Manganese
Manganese
Selenium
Selenium
0.71%
0.9%
3%
6%
0%
1.9%
7.7%
24%
0%
0.55%
Vitamin Comparison
Vitamin comparison score is based on the number of vitamins by which one or the other food is richer. The "coverage" charts below show how much of the daily needs can be covered by 300 grams of the food.
6
100 g
300 g
1 oz - 28.35g 10 twists - 60g
Vitamin C
Vit. C
Vitamin D
Vit. D
Vitamin A
Vit. A
Vitamin E
Vit. E
Vitamin B1
Vit. B1
Vitamin B2
Vit. B2
Vitamin B3
Vit. B3
Vitamin B5
Vit. B5
Vitamin B6
Vit. B6
Vitamin B12
Vit. B12
Vitamin K
Vit. K
Folate
Folate
7%
0%
0%
9.4%
106%
77%
99%
19%
17%
0%
7%
125%
2
100 g
300 g
2 tbsp creamy - 33g 0.083 package - 38g 1 package (16 oz) - 462g
Vitamin C
Vit. C
Vitamin D
Vit. D
Vitamin A
Vit. A
Vitamin E
Vit. E
Vitamin B1
Vit. B1
Vitamin B2
Vit. B2
Vitamin B3
Vit. B3
Vitamin B5
Vit. B5
Vitamin B6
Vit. B6
Vitamin B12
Vit. B12
Vitamin K
Vit. K
Folate
Folate
0%
0%
0%
31%
2.5%
70%
4.1%
3.3%
0%
0%
33%
6%
All nutrients comparison - raw data values
Nutrient
DV% diff.
Iron
4.58mg
0.16mg
55%
Sodium
1240mg
184mg
46%
Manganese
1.015mg
0mg
44%
Polyunsaturated fat
1.291g
7.951g
44%
Folate
166µg
8µg
40%
Vitamin B1
0.424mg
0.01mg
35%
Vitamin B3
5.27mg
0.22mg
32%
Starch
72.58g
30%
Protein
10.04g
0g
20%
Fats
2.93g
16.23g
20%
Copper
0.156mg
0mg
17%
Phosphorus
128mg
18mg
16%
Fiber
3.4g
0g
14%
Saturated fat
0.391g
2.974g
12%
Monounsaturated fat
0.727g
4.86g
10%
Zinc
1.04mg
0.07mg
9%
Vitamin K
2.8µg
13µg
9%
Selenium
4.4µg
0.1µg
8%
Magnesium
29mg
1mg
7%
Vitamin E
0.47mg
1.53mg
7%
Potassium
223mg
34mg
6%
Vitamin B6
0.074mg
0mg
6%
Vitamin B5
0.322mg
0.055mg
5%
Choline
29.5mg
2.3mg
5%
Carbs
80.39g
67.89g
4%
Calories
384kcal
418kcal
2%
Vitamin C
2.1mg
0mg
2%
Calcium
27mg
3mg
2%
Vitamin B2
0.332mg
0.302mg
2%
Protein per 100 calories
2.6g
0g
N/A
Calories per 10 g protein
382kcal
N/A
Weight per 100 calories
26g
24g
N/A
Unsaturated / Saturated Fat ratio
5.2
4.3
N/A
Net carbs
76.99g
67.89g
N/A
Sugar
2.21g
63.1g
N/A
Trans fat
0.004g
0g
N/A
Tryptophan
0.097mg
0%
Threonine
0.25mg
0%
Isoleucine
0.407mg
0%
Leucine
0.757mg
0%
Lysine
0.257mg
0%
Methionine
0.177mg
0%
Phenylalanine
0.52mg
0%
Valine
0.48mg
0%
Histidine
0.22mg
0%
Fructose
0.31g
0%
Omega-3 - ALA
0.063g
N/A
Omega-6 - Gamma-linoleic acid
0.001g
N/A
Omega-6 - Linoleic acid
1.223g
N/A
Macronutrient Comparison
Macronutrient breakdown side-by-side comparison
3
10%
3%
80%
3%
4%
Protein:
10.04 g
Fats:
2.93 g
Carbs:
80.39 g
Water:
3.13 g
Other:
3.51 g
2
16%
68%
15%
Protein:
0 g
Fats:
16.23 g
Carbs:
67.89 g
Water:
15.07 g
Other:
0.81 g
Contains
more
Protein Protein
+∞%
Contains
more
Carbs Carbs
+18.4%
Contains
more
Other Other
+333.3%
Contains
more
Fats Fats
+453.9%
Contains
more
Water Water
+381.5%
Fat Type Comparison
Fat type breakdown side-by-side comparison
1
16%
30%
54%
Saturated fat:
Sat. Fat
0.391 g
Monounsaturated fat:
Mono. Fat
0.727 g
Polyunsaturated fat:
Poly. Fat
1.291 g
2
19%
31%
50%
Saturated fat:
Sat. Fat
2.974 g
Monounsaturated fat:
Mono. Fat
4.86 g
Polyunsaturated fat:
Poly. Fat
7.951 g
Contains
less
Sat. Fat Saturated fat
-86.9%
Contains
more
Mono. Fat Monounsaturated fat
+568.5%
Contains
more
Poly. Fat Polyunsaturated fat
+515.9%