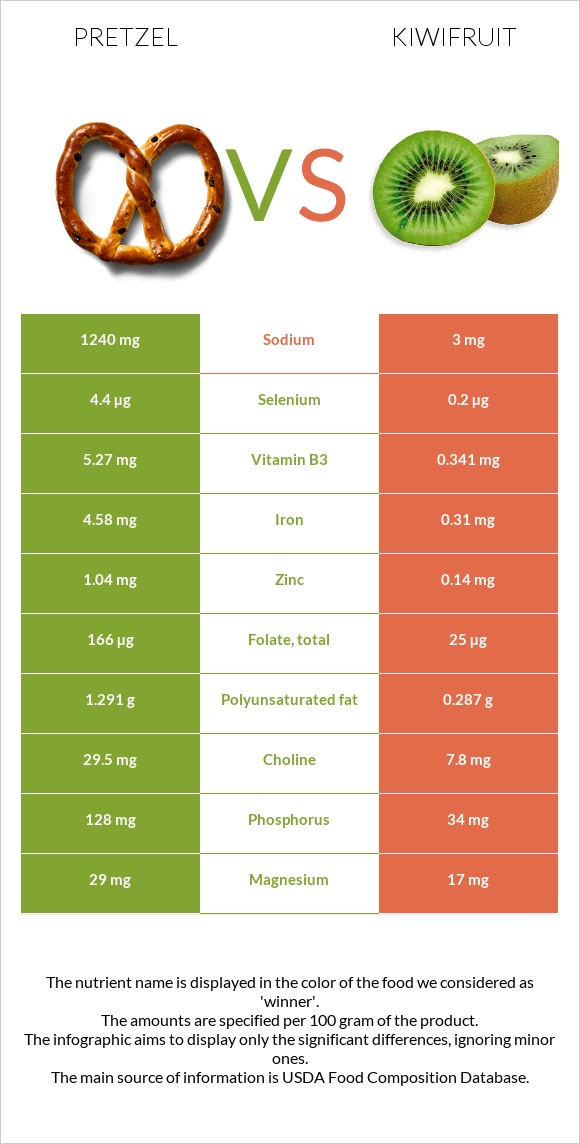
A recap on the differences between pretzel and kiwi Pretzel is higher in iron, manganese, folate, vitamin B1, vitamin B3, vitamin B2, and phosphorus, yet kiwi is higher in vitamin C and vitamin K. Kiwi covers your daily vitamin C needs 101% more than pretzel. Pretzel contains 413 times more sodium than kiwi. While pretzel contains 1240mg of sodium, kiwi contains only 3mg. The glycemic index of kiwi is lower. Food varieties used in this article are Snacks, pretzels, hard, plain, salted and Kiwifruit, green, raw .
Infographic
Mineral Comparison
Mineral comparison score is based on the number of minerals by which one or the other food is richer. The "coverage" charts below show how much of the daily needs can be covered by 300 grams of the food.
7
100 g
300 g
1 oz - 28.35g 10 twists - 60g
Magnesium
Magnesium
Calcium
Calcium
Potassium
Potassium
Iron
Iron
Copper
Copper
Zinc
Zinc
Phosphorus
Phosphorus
Sodium
Sodium
Manganese
Manganese
Selenium
Selenium
21%
8.1%
20%
172%
52%
28%
55%
162%
132%
24%
3
100 g
300 g
1 fruit (2" dia) - 69g 1 NLEA serving - 148g 1 cup, sliced - 180g
Magnesium
Magnesium
Calcium
Calcium
Potassium
Potassium
Iron
Iron
Copper
Copper
Zinc
Zinc
Phosphorus
Phosphorus
Sodium
Sodium
Manganese
Manganese
Selenium
Selenium
12%
10%
28%
12%
43%
3.8%
15%
0.39%
13%
1.1%
Vitamin Comparison
Vitamin comparison score is based on the number of vitamins by which one or the other food is richer. The "coverage" charts below show how much of the daily needs can be covered by 300 grams of the food.
6
100 g
300 g
1 oz - 28.35g 10 twists - 60g
Vitamin C
Vit. C
Vitamin D
Vit. D
Vitamin A
Vit. A
Vitamin E
Vit. E
Vitamin B1
Vit. B1
Vitamin B2
Vit. B2
Vitamin B3
Vit. B3
Vitamin B5
Vit. B5
Vitamin B6
Vit. B6
Vitamin B12
Vit. B12
Vitamin K
Vit. K
Folate
Folate
7%
0%
0%
9.4%
106%
77%
99%
19%
17%
0%
7%
125%
4
100 g
300 g
1 fruit (2" dia) - 69g 1 NLEA serving - 148g 1 cup, sliced - 180g
Vitamin C
Vit. C
Vitamin D
Vit. D
Vitamin A
Vit. A
Vitamin E
Vit. E
Vitamin B1
Vit. B1
Vitamin B2
Vit. B2
Vitamin B3
Vit. B3
Vitamin B5
Vit. B5
Vitamin B6
Vit. B6
Vitamin B12
Vit. B12
Vitamin K
Vit. K
Folate
Folate
309%
0%
1.3%
29%
6.8%
5.8%
6.4%
11%
15%
0%
101%
19%
All nutrients comparison - raw data values
Nutrient
DV% diff.
Vitamin C
2.1mg
92.7mg
101%
Sodium
1240mg
3mg
54%
Iron
4.58mg
0.31mg
53%
Manganese
1.015mg
0.098mg
40%
Folate
166µg
25µg
35%
Vitamin B1
0.424mg
0.027mg
33%
Vitamin B3
5.27mg
0.341mg
31%
Vitamin K
2.8µg
40.3µg
31%
Starch
72.58g
0g
30%
Vitamin B2
0.332mg
0.025mg
24%
Carbs
80.39g
14.66g
22%
Protein
10.04g
1.14g
18%
Calories
384kcal
61kcal
16%
Phosphorus
128mg
34mg
13%
Zinc
1.04mg
0.14mg
8%
Selenium
4.4µg
0.2µg
8%
Vitamin E
0.47mg
1.46mg
7%
Polyunsaturated fat
1.291g
0.287g
7%
Fructose
0.31g
4.35g
5%
Fats
2.93g
0.52g
4%
Choline
29.5mg
7.8mg
4%
Magnesium
29mg
17mg
3%
Potassium
223mg
312mg
3%
Copper
0.156mg
0.13mg
3%
Vitamin B5
0.322mg
0.183mg
3%
Fiber
3.4g
3g
2%
Saturated fat
0.391g
0.029g
2%
Monounsaturated fat
0.727g
0.047g
2%
Calcium
27mg
34mg
1%
Vitamin B6
0.074mg
0.063mg
1%
Protein per 100 calories
2.6g
1.9g
N/A
Calories per 10 g protein
382kcal
535kcal
N/A
Weight per 100 calories
26g
164g
N/A
Unsaturated / Saturated Fat ratio
5.2
12
N/A
Net carbs
76.99g
11.66g
N/A
Sugar
2.21g
8.99g
N/A
Vitamin A
0µg
4µg
0%
Trans fat
0.004g
0g
N/A
Tryptophan
0.097mg
0.015mg
0%
Threonine
0.25mg
0.047mg
0%
Isoleucine
0.407mg
0.051mg
0%
Leucine
0.757mg
0.066mg
0%
Lysine
0.257mg
0.061mg
0%
Methionine
0.177mg
0.024mg
0%
Phenylalanine
0.52mg
0.044mg
0%
Valine
0.48mg
0.057mg
0%
Histidine
0.22mg
0.027mg
0%
Omega-3 - ALA
0.063g
N/A
Omega-6 - Gamma-linoleic acid
0.001g
N/A
Omega-6 - Linoleic acid
1.223g
N/A
Macronutrient Comparison
Macronutrient breakdown side-by-side comparison
4
10%
3%
80%
3%
4%
Protein:
10.04 g
Fats:
2.93 g
Carbs:
80.39 g
Water:
3.13 g
Other:
3.51 g
1
15%
83%
Protein:
1.14 g
Fats:
0.52 g
Carbs:
14.66 g
Water:
83.07 g
Other:
0.61 g
Contains
more
Protein Protein
+780.7%
Contains
more
Fats Fats
+463.5%
Contains
more
Carbs Carbs
+448.4%
Contains
more
Other Other
+475.4%
Contains
more
Water Water
+2554%
Fat Type Comparison
Fat type breakdown side-by-side comparison
2
16%
30%
54%
Saturated fat:
Sat. Fat
0.391 g
Monounsaturated fat:
Mono. Fat
0.727 g
Polyunsaturated fat:
Poly. Fat
1.291 g
1
8%
13%
79%
Saturated fat:
Sat. Fat
0.029 g
Monounsaturated fat:
Mono. Fat
0.047 g
Polyunsaturated fat:
Poly. Fat
0.287 g
Contains
more
Mono. Fat Monounsaturated fat
+1446.8%
Contains
more
Poly. Fat Polyunsaturated fat
+349.8%
Contains
less
Sat. Fat Saturated fat
-92.6%
Carbohydrate type comparison
Carbohydrate type breakdown side-by-side comparison
2
97%
Starch:
72.58 g
Sucrose:
0 g
Glucose:
0.69 g
Fructose:
0.31 g
Lactose:
0 g
Maltose:
1.11 g
Galactose:
0 g
4
2%
46%
48%
2%
2%
Starch:
0 g
Sucrose:
0.15 g
Glucose:
4.11 g
Fructose:
4.35 g
Lactose:
0 g
Maltose:
0.19 g
Galactose:
0.17 g
Contains
more
Starch Starch
+∞%
Contains
more
Maltose Maltose
+484.2%
Contains
more
Sucrose Sucrose
+∞%
Contains
more
Glucose Glucose
+495.7%
Contains
more
Fructose Fructose
+1303.2%
Contains
more
Galactose Galactose
+∞%