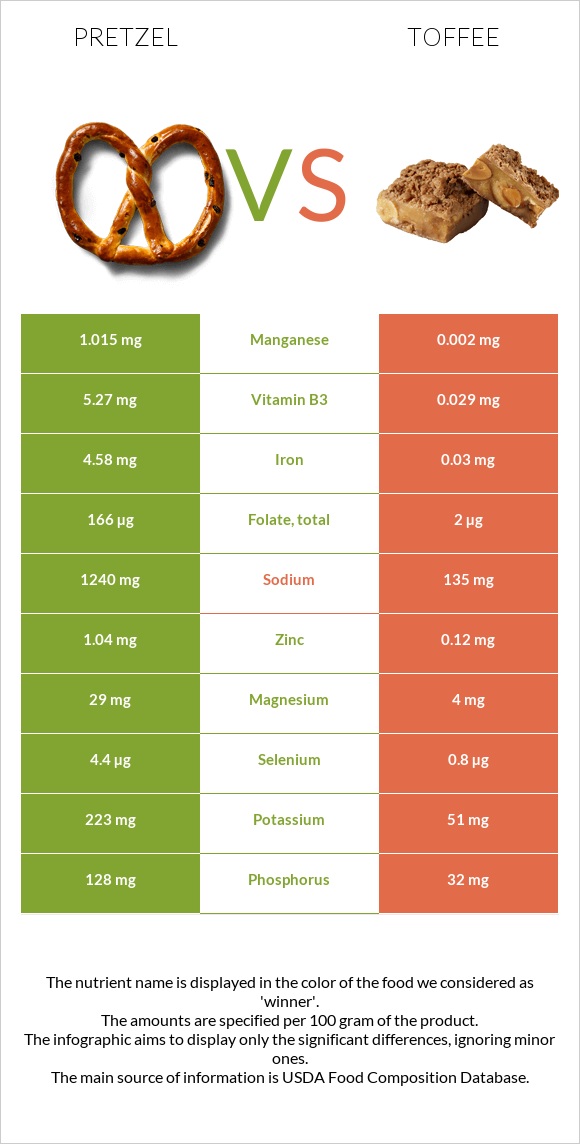
Significant differences between pretzel and toffee Pretzel has more iron, manganese, folate, vitamin B1, vitamin B3, and vitamin B2; however, toffee is richer in vitamin A. Toffee covers your daily saturated fat needs 101% more than pretzel. Toffee has 508 times less manganese than pretzel. Pretzel has 1.015mg of manganese, while toffee has 0.002mg. Toffee contains less sodium. Pretzel has a higher glycemic index. The glycemic index of pretzel is 83, while the glycemic index of toffee is 51. Specific food types used in this comparison are Snacks, pretzels, hard, plain, salted and Candies, toffee, prepared-from-recipe .
Infographic
Mineral Comparison
Mineral comparison score is based on the number of minerals by which one or the other food is richer. The "coverage" charts below show how much of the daily needs can be covered by 300 grams of the food.
8
100 g
300 g
1 oz - 28.35g 10 twists - 60g
Magnesium
Magnesium
Calcium
Calcium
Potassium
Potassium
Iron
Iron
Copper
Copper
Zinc
Zinc
Phosphorus
Phosphorus
Sodium
Sodium
Manganese
Manganese
Selenium
Selenium
21%
8.1%
20%
172%
52%
28%
55%
162%
132%
24%
2
100 g
300 g
1 piece - 12g
Magnesium
Magnesium
Calcium
Calcium
Potassium
Potassium
Iron
Iron
Copper
Copper
Zinc
Zinc
Phosphorus
Phosphorus
Sodium
Sodium
Manganese
Manganese
Selenium
Selenium
2.9%
10%
4.5%
1.1%
1%
3.3%
14%
18%
0.26%
4.4%
Vitamin Comparison
Vitamin comparison score is based on the number of vitamins by which one or the other food is richer. The "coverage" charts below show how much of the daily needs can be covered by 300 grams of the food.
7
100 g
300 g
1 oz - 28.35g 10 twists - 60g
Vitamin C
Vit. C
Vitamin D
Vit. D
Vitamin A
Vit. A
Vitamin E
Vit. E
Vitamin B1
Vit. B1
Vitamin B2
Vit. B2
Vitamin B3
Vit. B3
Vitamin B5
Vit. B5
Vitamin B6
Vit. B6
Vitamin B12
Vit. B12
Vitamin K
Vit. K
Folate
Folate
7%
0%
0%
9.4%
106%
77%
99%
19%
17%
0%
7%
125%
3
100 g
300 g
1 piece - 12g
Vitamin C
Vit. C
Vitamin D
Vit. D
Vitamin A
Vit. A
Vitamin E
Vit. E
Vitamin B1
Vit. B1
Vitamin B2
Vit. B2
Vitamin B3
Vit. B3
Vitamin B5
Vit. B5
Vitamin B6
Vit. B6
Vitamin B12
Vit. B12
Vitamin K
Vit. K
Folate
Folate
0.67%
0%
106%
19%
2%
16%
0.54%
8%
2.1%
14%
7%
1.5%
All nutrients comparison - raw data values
Nutrient
DV% diff.
Saturated fat
0.391g
20.565g
92%
Iron
4.58mg
0.03mg
57%
Sodium
1240mg
135mg
48%
Fats
2.93g
32.75g
46%
Manganese
1.015mg
0.002mg
44%
Folate
166µg
2µg
41%
Cholesterol
0mg
104mg
35%
Vitamin A
0µg
319µg
35%
Vitamin B1
0.424mg
0.008mg
35%
Vitamin B3
5.27mg
0.029mg
33%
Starch
72.58g
30%
Monounsaturated fat
0.727g
8.964g
21%
Vitamin B2
0.332mg
0.068mg
20%
Protein
10.04g
1.07g
18%
Copper
0.156mg
0.003mg
17%
Fiber
3.4g
0g
14%
Phosphorus
128mg
32mg
14%
Calories
384kcal
560kcal
9%
Zinc
1.04mg
0.12mg
8%
Selenium
4.4µg
0.8µg
7%
Magnesium
29mg
4mg
6%
Carbs
80.39g
64.72g
5%
Potassium
223mg
51mg
5%
Vitamin B6
0.074mg
0.009mg
5%
Vitamin B12
0µg
0.11µg
5%
Choline
29.5mg
5%
Vitamin B5
0.322mg
0.134mg
4%
Vitamin E
0.47mg
0.94mg
3%
Vitamin C
2.1mg
0.2mg
2%
Calcium
27mg
34mg
1%
Protein per 100 calories
2.6g
0.19g
N/A
Calories per 10 g protein
382kcal
5234kcal
N/A
Weight per 100 calories
26g
18g
N/A
Unsaturated / Saturated Fat ratio
5.2
0.5
N/A
Net carbs
76.99g
64.72g
N/A
Sugar
2.21g
63.47g
N/A
Vitamin K
2.8µg
2.8µg
0%
Trans fat
0.004g
0.674g
N/A
Polyunsaturated fat
1.291g
1.222g
0%
Tryptophan
0.097mg
0%
Threonine
0.25mg
0%
Isoleucine
0.407mg
0%
Leucine
0.757mg
0%
Lysine
0.257mg
0%
Methionine
0.177mg
0%
Phenylalanine
0.52mg
0%
Valine
0.48mg
0%
Histidine
0.22mg
0%
Fructose
0.31g
0%
Omega-3 - ALA
0.063g
0.065g
N/A
Omega-6 - Gamma-linoleic acid
0.001g
N/A
Omega-6 - Linoleic acid
1.223g
0.445g
N/A
Macronutrient Comparison
Macronutrient breakdown side-by-side comparison
4
10%
3%
80%
3%
4%
Protein:
10.04 g
Fats:
2.93 g
Carbs:
80.39 g
Water:
3.13 g
Other:
3.51 g
1
33%
65%
Protein:
1.07 g
Fats:
32.75 g
Carbs:
64.72 g
Water:
0.55 g
Other:
0.91 g
Contains
more
Protein Protein
+838.3%
Contains
more
Carbs Carbs
+24.2%
Contains
more
Water Water
+469.1%
Contains
more
Other Other
+285.7%
Contains
more
Fats Fats
+1017.7%
Fat Type Comparison
Fat type breakdown side-by-side comparison
2
16%
30%
54%
Saturated fat:
Sat. Fat
0.391 g
Monounsaturated fat:
Mono. Fat
0.727 g
Polyunsaturated fat:
Poly. Fat
1.291 g
1
67%
29%
4%
Saturated fat:
Sat. Fat
20.565 g
Monounsaturated fat:
Mono. Fat
8.964 g
Polyunsaturated fat:
Poly. Fat
1.222 g
Contains
less
Sat. Fat Saturated fat
-98.1%
Contains
more
Mono. Fat Monounsaturated fat
+1133%
~equal in
Polyunsaturated fat
~1.222g