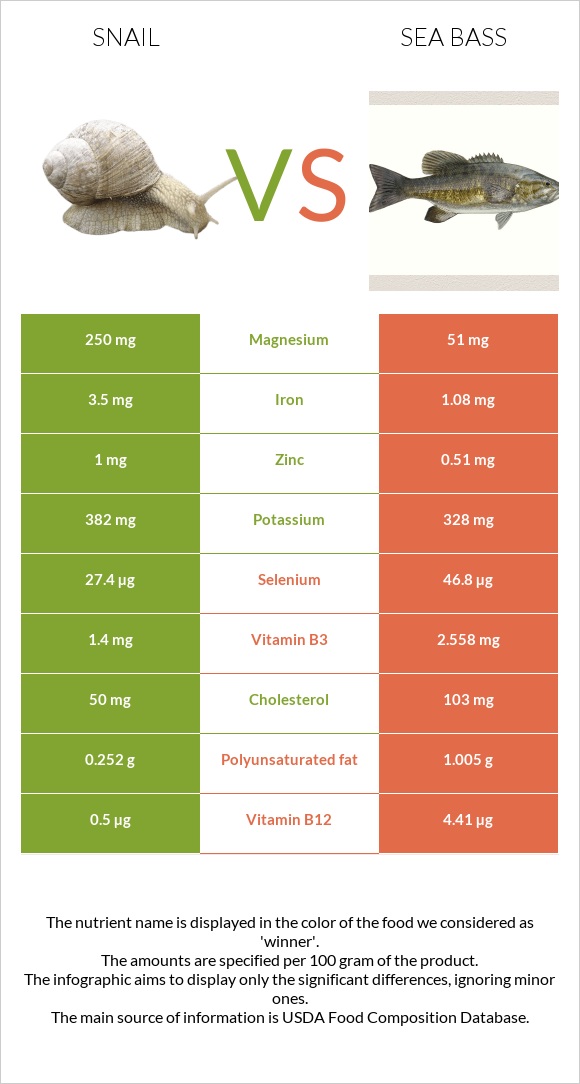
How are snail and sea bass different? Snail is richer in magnesium, copper, iron, and vitamin B2, while sea bass is higher in vitamin B12, selenium, vitamin B6, vitamin B1, and vitamin B3. Sea bass covers your daily need for vitamin B12, 163% more than snail. Snail contains 10 times more copper than sea bass. Snail contains 0.4mg of copper, while sea bass contains 0.04mg. Snail is lower in cholesterol. Mollusks, snail, raw and Fish, bass, striped, cooked, dry heat types were used in this article.
Infographic
Mineral Comparison
Mineral comparison score is based on the number of minerals by which one or the other food is richer. The "coverage" charts below show how much of the daily needs can be covered by 300 grams of the food.
6
100 g
300 g
3 oz - 85g
Magnesium
Magnesium
Calcium
Calcium
Potassium
Potassium
Iron
Iron
Copper
Copper
Zinc
Zinc
Phosphorus
Phosphorus
Sodium
Sodium
Manganese
Manganese
Selenium
Selenium
179%
3%
34%
131%
133%
27%
117%
9.1%
0%
149%
3
100 g
300 g
3 oz - 85g 1 fillet - 124g
Magnesium
Magnesium
Calcium
Calcium
Potassium
Potassium
Iron
Iron
Copper
Copper
Zinc
Zinc
Phosphorus
Phosphorus
Sodium
Sodium
Manganese
Manganese
Selenium
Selenium
36%
5.7%
29%
41%
13%
14%
109%
11%
2.5%
255%
Vitamin Comparison
Vitamin comparison score is based on the number of vitamins by which one or the other food is richer. The "coverage" charts below show how much of the daily needs can be covered by 300 grams of the food.
3
100 g
300 g
3 oz - 85g
Vitamin C
Vit. C
Vitamin D
Vit. D
Vitamin A
Vit. A
Vitamin E
Vit. E
Vitamin B1
Vit. B1
Vitamin B2
Vit. B2
Vitamin B3
Vit. B3
Vitamin B5
Vit. B5
Vitamin B6
Vit. B6
Vitamin B12
Vit. B12
Vitamin K
Vit. K
Folate
Folate
0%
0%
10%
100%
2.5%
28%
26%
0%
30%
63%
0.25%
4.5%
6
100 g
300 g
3 oz - 85g 1 fillet - 124g
Vitamin C
Vit. C
Vitamin D
Vit. D
Vitamin A
Vit. A
Vitamin E
Vit. E
Vitamin B1
Vit. B1
Vitamin B2
Vit. B2
Vitamin B3
Vit. B3
Vitamin B5
Vit. B5
Vitamin B6
Vit. B6
Vitamin B12
Vit. B12
Vitamin K
Vit. K
Folate
Folate
0%
0%
10%
0%
29%
8.5%
48%
52%
80%
551%
0%
7.5%
All nutrients comparison - raw data values
Nutrient
DV% diff.
Vitamin B12
0.5µg
4.41µg
163%
Magnesium
250mg
51mg
47%
Copper
0.4mg
0.04mg
40%
Selenium
27.4µg
46.8µg
35%
Vitamin E
5mg
33%
Iron
3.5mg
1.08mg
30%
Cholesterol
50mg
103mg
18%
Vitamin B5
0.865mg
17%
Vitamin B6
0.13mg
0.346mg
17%
Protein
16.1g
22.73g
13%
Choline
65mg
12%
Vitamin B1
0.01mg
0.115mg
9%
Vitamin B3
1.4mg
2.558mg
7%
Vitamin B2
0.12mg
0.037mg
6%
Polyunsaturated fat
0.252g
1.005g
5%
Zinc
1mg
0.51mg
4%
Phosphorus
272mg
254mg
3%
Calories
90kcal
124kcal
2%
Fats
1.4g
2.99g
2%
Potassium
382mg
328mg
2%
Carbs
2g
0g
1%
Calcium
10mg
19mg
1%
Sodium
70mg
88mg
1%
Manganese
0.019mg
1%
Folate
6µg
10µg
1%
Saturated fat
0.361g
0.65g
1%
Monounsaturated fat
0.259g
0.846g
1%
Protein per 100 calories
18g
18g
N/A
Calories per 10 g protein
56kcal
55kcal
N/A
Weight per 100 calories
111g
81g
N/A
Unsaturated / Saturated Fat ratio
1.4
2.8
N/A
Net carbs
2g
0g
N/A
Vitamin A
30µg
31µg
0%
Vitamin K
0.1µg
0%
Tryptophan
0.255mg
0%
Threonine
0.997mg
0%
Isoleucine
1.047mg
0%
Leucine
1.848mg
0%
Lysine
2.088mg
0%
Methionine
0.673mg
0%
Phenylalanine
0.887mg
0%
Valine
1.171mg
0%
Histidine
0.669mg
0%
Omega-3 - EPA
0.119g
0.217g
N/A
Omega-3 - DHA
0g
0.75g
N/A
Omega-3 - DPA
0.099g
N/A
Macronutrient Comparison
Macronutrient breakdown side-by-side comparison
3
16%
2%
79%
Protein:
16.1 g
Fats:
1.4 g
Carbs:
2 g
Water:
79.2 g
Other:
1.3 g
2
23%
3%
73%
Protein:
22.73 g
Fats:
2.99 g
Carbs:
0 g
Water:
73.36 g
Other:
0.92 g
Contains
more
Carbs Carbs
+∞%
Contains
more
Other Other
+41.3%
Contains
more
Protein Protein
+41.2%
Contains
more
Fats Fats
+113.6%
Fat Type Comparison
Fat type breakdown side-by-side comparison
1
41%
30%
29%
Saturated fat:
Sat. Fat
0.361 g
Monounsaturated fat:
Mono. Fat
0.259 g
Polyunsaturated fat:
Poly. Fat
0.252 g
2
26%
34%
40%
Saturated fat:
Sat. Fat
0.65 g
Monounsaturated fat:
Mono. Fat
0.846 g
Polyunsaturated fat:
Poly. Fat
1.005 g
Contains
less
Sat. Fat Saturated fat
-44.5%
Contains
more
Mono. Fat Monounsaturated fat
+226.6%
Contains
more
Poly. Fat Polyunsaturated fat
+298.8%