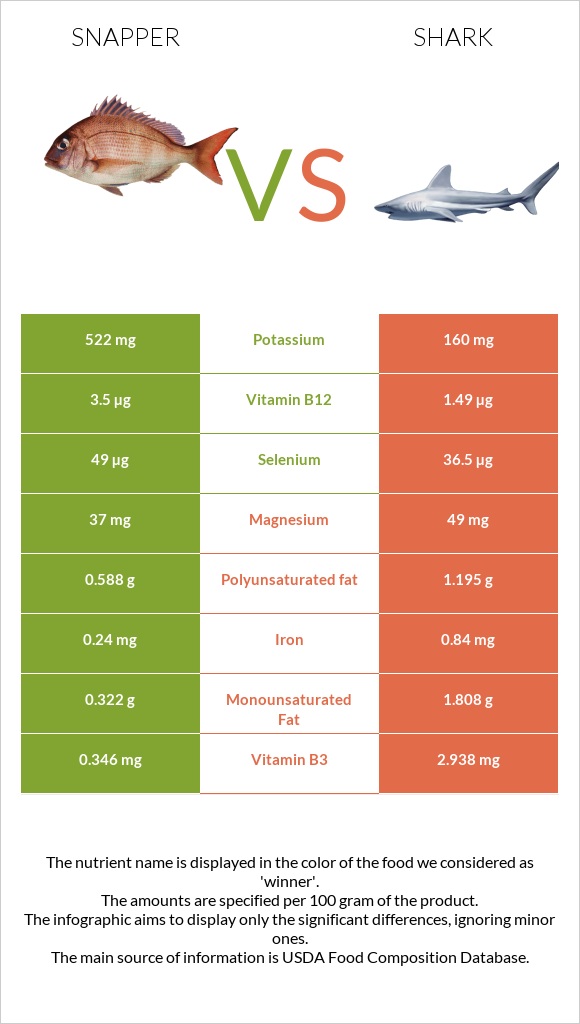
How are snapper and shark different? Snapper is richer in vitamin B12, selenium, vitamin B6, and potassium, while shark is higher in vitamin B3, iron, vitamin B2, and polyunsaturated fat. Snapper covers your daily need for vitamin B12, 95% more than shark. Snapper contains 3 times more potassium than shark. Snapper contains 522mg of potassium, while shark contains 155mg. Snapper is lower in saturated fat. Fish, snapper, mixed species, cooked, dry heat and Fish, shark, mixed species, cooked, batter-dipped and fried types were used in this article.
Infographic
Mineral Comparison
Mineral comparison score is based on the number of minerals by which one or the other food is richer. The "coverage" charts below show how much of the daily needs can be covered by 300 grams of the food.
3
100 g
300 g
3 oz - 85g 1 fillet - 170g
Magnesium
Magnesium
Calcium
Calcium
Potassium
Potassium
Iron
Iron
Copper
Copper
Zinc
Zinc
Phosphorus
Phosphorus
Sodium
Sodium
Manganese
Manganese
Selenium
Selenium
26%
12%
46%
9%
15%
12%
86%
7.4%
2.2%
267%
4
100 g
300 g
3 oz - 85g
Magnesium
Magnesium
Calcium
Calcium
Potassium
Potassium
Iron
Iron
Copper
Copper
Zinc
Zinc
Phosphorus
Phosphorus
Sodium
Sodium
Manganese
Manganese
Selenium
Selenium
31%
15%
14%
42%
14%
13%
83%
16%
6.5%
185%
Vitamin Comparison
Vitamin comparison score is based on the number of vitamins by which one or the other food is richer. The "coverage" charts below show how much of the daily needs can be covered by 300 grams of the food.
4
100 g
300 g
3 oz - 85g 1 fillet - 170g
Vitamin C
Vit. C
Vitamin D
Vit. D
Vitamin A
Vit. A
Vitamin E
Vit. E
Vitamin B1
Vit. B1
Vitamin B2
Vit. B2
Vitamin B3
Vit. B3
Vitamin B5
Vit. B5
Vitamin B6
Vit. B6
Vitamin B12
Vit. B12
Vitamin K
Vit. K
Folate
Folate
5.3%
0%
12%
0%
13%
0.92%
6.5%
52%
106%
438%
0%
4.5%
5
100 g
300 g
3 oz - 85g
Vitamin C
Vit. C
Vitamin D
Vit. D
Vitamin A
Vit. A
Vitamin E
Vit. E
Vitamin B1
Vit. B1
Vitamin B2
Vit. B2
Vitamin B3
Vit. B3
Vitamin B5
Vit. B5
Vitamin B6
Vit. B6
Vitamin B12
Vit. B12
Vitamin K
Vit. K
Folate
Folate
0%
0%
18%
0%
18%
22%
52%
37%
69%
151%
0%
11%
All nutrients comparison - raw data values
Nutrient
DV% diff.
Vitamin B12
3.5µg
1.21µg
95%
Selenium
49µg
34µg
27%
Polyunsaturated fat
0.588g
3.701g
21%
Fats
1.72g
13.82g
19%
Protein
26.3g
18.62g
15%
Vitamin B3
0.346mg
2.783mg
15%
Monounsaturated fat
0.322g
5.935g
14%
Saturated fat
0.365g
3.205g
13%
Vitamin B6
0.46mg
0.3mg
12%
Potassium
522mg
155mg
11%
Iron
0.24mg
1.11mg
11%
Vitamin B2
0.004mg
0.097mg
7%
Calories
128kcal
228kcal
5%
Vitamin B5
0.87mg
0.62mg
5%
Cholesterol
47mg
59mg
4%
Sodium
57mg
122mg
3%
Vitamin C
1.6mg
0mg
2%
Carbs
0g
6.39g
2%
Vitamin A
35µg
54µg
2%
Vitamin B1
0.053mg
0.072mg
2%
Folate
6µg
15µg
2%
Magnesium
37mg
43mg
1%
Calcium
40mg
50mg
1%
Phosphorus
201mg
194mg
1%
Manganese
0.017mg
0.05mg
1%
Protein per 100 calories
21g
8.2g
N/A
Calories per 10 g protein
49kcal
122kcal
N/A
Weight per 100 calories
78g
44g
N/A
Unsaturated / Saturated Fat ratio
2.5
3
N/A
Net carbs
0g
6.39g
N/A
Copper
0.046mg
0.042mg
0%
Zinc
0.44mg
0.48mg
0%
Tryptophan
0.294mg
0.212mg
0%
Threonine
1.153mg
0.843mg
0%
Isoleucine
1.212mg
0.867mg
0%
Leucine
2.137mg
1.515mg
0%
Lysine
2.415mg
1.634mg
0%
Methionine
0.778mg
0.541mg
0%
Phenylalanine
1.027mg
0.75mg
0%
Valine
1.355mg
0.965mg
0%
Histidine
0.774mg
0.538mg
0%
Omega-3 - EPA
0.048g
0.258g
N/A
Omega-3 - DHA
0.273g
0.431g
N/A
Omega-3 - DPA
0.022g
0.089g
N/A
Macronutrient Comparison
Macronutrient breakdown side-by-side comparison
3
26%
2%
70%
Protein:
26.3 g
Fats:
1.72 g
Carbs:
0 g
Water:
70.35 g
Other:
1.63 g
2
19%
14%
6%
60%
Protein:
18.62 g
Fats:
13.82 g
Carbs:
6.39 g
Water:
60.09 g
Other:
1.08 g
Contains
more
Protein Protein
+41.2%
Contains
more
Water Water
+17.1%
Contains
more
Other Other
+50.9%
Contains
more
Fats Fats
+703.5%
Contains
more
Carbs Carbs
+∞%
Fat Type Comparison
Fat type breakdown side-by-side comparison
1
29%
25%
46%
Saturated fat:
Sat. Fat
0.365 g
Monounsaturated fat:
Mono. Fat
0.322 g
Polyunsaturated fat:
Poly. Fat
0.588 g
2
25%
46%
29%
Saturated fat:
Sat. Fat
3.205 g
Monounsaturated fat:
Mono. Fat
5.935 g
Polyunsaturated fat:
Poly. Fat
3.701 g
Contains
less
Sat. Fat Saturated fat
-88.6%
Contains
more
Mono. Fat Monounsaturated fat
+1743.2%
Contains
more
Poly. Fat Polyunsaturated fat
+529.4%