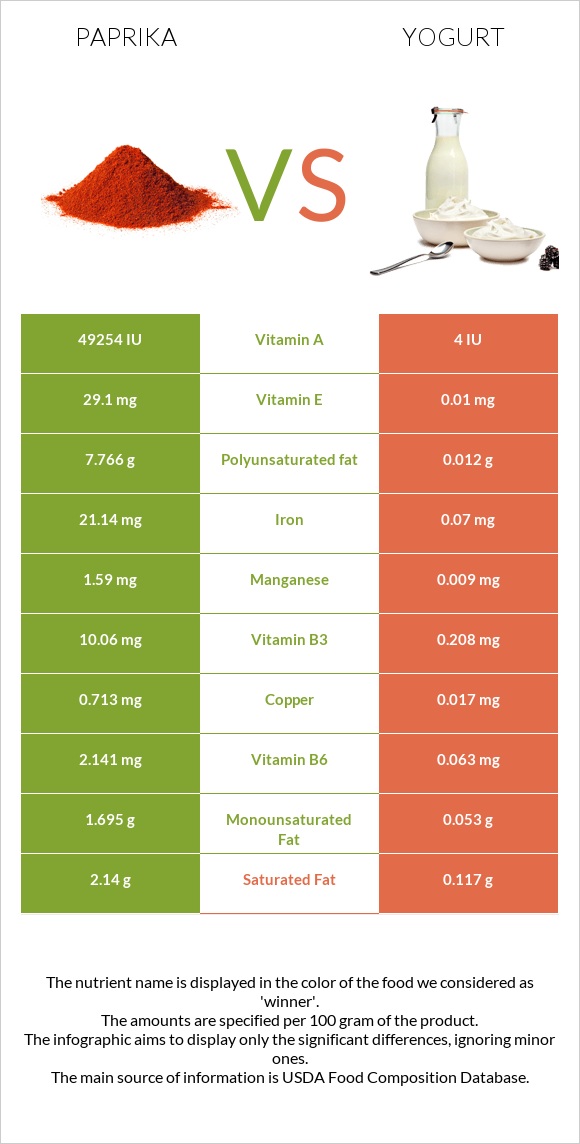
The main differences between paprika and yogurt Paprika is richer than yogurt in vitamin A, iron, vitamin E, vitamin B6, fiber, copper, vitamin B2, manganese, vitamin K, and potassium. Daily need coverage for vitamin A for paprika is 985% higher. Paprika has a lower glycemic index than yogurt. Food types used in this article are Spices, paprika and Yogurt, Greek, plain, nonfat .
Infographic
Mineral Comparison
Mineral comparison score is based on the number of minerals by which one or the other food is richer. The "coverage" charts below show how much of the daily needs can be covered by 300 grams of the food.
8
100 g
300 g
0.25 tsp - 0.5g 1 tbsp - 6.8g
Magnesium
Magnesium
Calcium
Calcium
Potassium
Potassium
Iron
Iron
Copper
Copper
Zinc
Zinc
Phosphorus
Phosphorus
Sodium
Sodium
Manganese
Manganese
Selenium
Selenium
127%
69%
201%
793%
238%
118%
135%
8.9%
207%
34%
2
100 g
300 g
1 container - 170g
Magnesium
Magnesium
Calcium
Calcium
Potassium
Potassium
Iron
Iron
Copper
Copper
Zinc
Zinc
Phosphorus
Phosphorus
Sodium
Sodium
Manganese
Manganese
Selenium
Selenium
7.9%
33%
12%
2.6%
5.7%
14%
58%
4.7%
1.2%
53%
Vitamin Comparison
Vitamin comparison score is based on the number of vitamins by which one or the other food is richer. The "coverage" charts below show how much of the daily needs can be covered by 300 grams of the food.
10
100 g
300 g
0.25 tsp - 0.5g 1 tbsp - 6.8g
Vitamin C
Vit. C
Vitamin D
Vit. D
Vitamin A
Vit. A
Vitamin E
Vit. E
Vitamin B1
Vit. B1
Vitamin B2
Vit. B2
Vitamin B3
Vit. B3
Vitamin B5
Vit. B5
Vitamin B6
Vit. B6
Vitamin B12
Vit. B12
Vitamin K
Vit. K
Folate
Folate
3%
0%
821%
582%
83%
284%
189%
151%
494%
0%
201%
37%
1
100 g
300 g
1 container - 170g
Vitamin C
Vit. C
Vitamin D
Vit. D
Vitamin A
Vit. A
Vitamin E
Vit. E
Vitamin B1
Vit. B1
Vitamin B2
Vit. B2
Vitamin B3
Vit. B3
Vitamin B5
Vit. B5
Vitamin B6
Vit. B6
Vitamin B12
Vit. B12
Vitamin K
Vit. K
Folate
Folate
0%
0%
0.33%
0.2%
5.8%
64%
3.9%
20%
15%
94%
0%
5.3%
All nutrients comparison - raw data values
Nutrient
DV% diff.
Vitamin A
2463µg
1µg
274%
Iron
21.14mg
0.07mg
263%
Vitamin E
29.1mg
0.01mg
194%
Vitamin B6
2.141mg
0.063mg
160%
Fiber
34.9g
0g
140%
Copper
0.713mg
0.017mg
77%
Vitamin B2
1.23mg
0.278mg
73%
Manganese
1.59mg
0.009mg
69%
Vitamin K
80.3µg
0µg
67%
Potassium
2280mg
141mg
63%
Vitamin B3
10.06mg
0.208mg
62%
Polyunsaturated fat
7.766g
0.012g
52%
Vitamin B5
2.51mg
0.331mg
44%
Magnesium
178mg
11mg
40%
Zinc
4.33mg
0.52mg
35%
Vitamin B12
0µg
0.75µg
31%
Phosphorus
314mg
135mg
26%
Vitamin B1
0.33mg
0.023mg
26%
Fats
12.89g
0.39g
19%
Carbs
53.99g
3.6g
17%
Calcium
229mg
110mg
12%
Calories
282kcal
59kcal
11%
Folate
49µg
7µg
11%
Saturated fat
2.14g
0.117g
9%
Protein
14.14g
10.19g
8%
Fructose
6.71g
0g
8%
Choline
51.5mg
15.1mg
7%
Selenium
6.3µg
9.7µg
6%
Monounsaturated fat
1.695g
0.053g
4%
Cholesterol
0mg
5mg
2%
Vitamin C
0.9mg
0mg
1%
Sodium
68mg
36mg
1%
Protein per 100 calories
5g
17g
N/A
Calories per 10 g protein
199kcal
58kcal
N/A
Weight per 100 calories
35g
169g
N/A
Unsaturated / Saturated Fat ratio
4.4
0.56
N/A
Net carbs
19.09g
3.6g
N/A
Sugar
10.34g
3.24g
N/A
Trans fat
0g
0.006g
N/A
Tryptophan
0.07mg
0%
Threonine
0.49mg
0%
Isoleucine
0.57mg
0%
Leucine
0.92mg
0%
Lysine
0.69mg
0%
Methionine
0.2mg
0%
Phenylalanine
0.61mg
0%
Valine
0.75mg
0%
Histidine
0.25mg
0%
Omega-3 - ALA
0.453g
0.001g
N/A
Omega-6 - Linoleic acid
0.01g
N/A
Macronutrient Comparison
Macronutrient breakdown side-by-side comparison
4
14%
13%
54%
11%
8%
Protein:
14.14 g
Fats:
12.89 g
Carbs:
53.99 g
Water:
11.24 g
Other:
7.74 g
1
10%
4%
85%
Protein:
10.19 g
Fats:
0.39 g
Carbs:
3.6 g
Water:
85.1 g
Other:
0.72 g
Contains
more
Protein Protein
+38.8%
Contains
more
Fats Fats
+3205.1%
Contains
more
Carbs Carbs
+1399.7%
Contains
more
Other Other
+975%
Contains
more
Water Water
+657.1%
Fat Type Comparison
Fat type breakdown side-by-side comparison
2
18%
15%
67%
Saturated fat:
Sat. Fat
2.14 g
Monounsaturated fat:
Mono. Fat
1.695 g
Polyunsaturated fat:
Poly. Fat
7.766 g
1
64%
29%
7%
Saturated fat:
Sat. Fat
0.117 g
Monounsaturated fat:
Mono. Fat
0.053 g
Polyunsaturated fat:
Poly. Fat
0.012 g
Contains
more
Mono. Fat Monounsaturated fat
+3098.1%
Contains
more
Poly. Fat Polyunsaturated fat
+64616.7%
Contains
less
Sat. Fat Saturated fat
-94.5%
Carbohydrate type comparison
Carbohydrate type breakdown side-by-side comparison
3
8%
25%
65%
2%
Starch:
0 g
Sucrose:
0.81 g
Glucose:
2.63 g
Fructose:
6.71 g
Lactose:
0 g
Maltose:
0 g
Galactose:
0.19 g
2
78%
22%
Starch:
0 g
Sucrose:
0 g
Glucose:
0 g
Fructose:
0 g
Lactose:
2.54 g
Maltose:
0 g
Galactose:
0.7 g
Contains
more
Sucrose Sucrose
+∞%
Contains
more
Glucose Glucose
+∞%
Contains
more
Fructose Fructose
+∞%
Contains
more
Lactose Lactose
+∞%
Contains
more
Galactose Galactose
+268.4%
~equal in
Starch
~0g
~equal in
Maltose
~0g