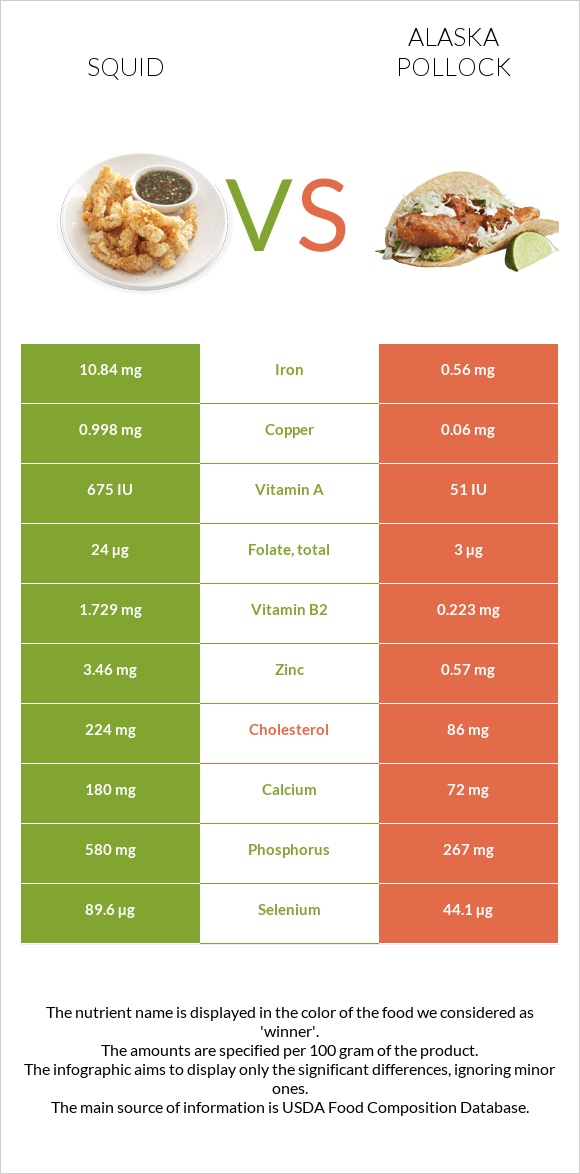
What are the main differences between squid and pollock? Squid has more iron, vitamin B2, copper, selenium, vitamin B12, phosphorus, zinc, and vitamin A than pollock. Squid's daily need coverage for iron is 129% higher. Pollock has 17 times less copper than squid. Squid has 0.998mg of copper, while pollock has 0.06mg. Pollock is lower in cholesterol. We used Mollusks, cuttlefish, mixed species, cooked, moist heat and Fish, pollock, Alaska, cooked, dry heat (may have been previously frozen) types in this comparison.
Infographic
Mineral Comparison
Mineral comparison score is based on the number of minerals by which one or the other food is richer. The "coverage" charts below show how much of the daily needs can be covered by 300 grams of the food.
8
100 g
300 g
3 oz - 85g
Magnesium
Magnesium
Calcium
Calcium
Potassium
Potassium
Iron
Iron
Copper
Copper
Zinc
Zinc
Phosphorus
Phosphorus
Sodium
Sodium
Manganese
Manganese
Selenium
Selenium
43%
54%
56%
407%
333%
94%
249%
97%
27%
489%
2
100 g
300 g
1 fillet - 60g 3 oz - 85g
Magnesium
Magnesium
Calcium
Calcium
Potassium
Potassium
Iron
Iron
Copper
Copper
Zinc
Zinc
Phosphorus
Phosphorus
Sodium
Sodium
Manganese
Manganese
Selenium
Selenium
58%
22%
38%
21%
20%
16%
114%
55%
2.3%
241%
Vitamin Comparison
Vitamin comparison score is based on the number of vitamins by which one or the other food is richer. The "coverage" charts below show how much of the daily needs can be covered by 300 grams of the food.
6
100 g
300 g
3 oz - 85g
Vitamin C
Vit. C
Vitamin D
Vit. D
Vitamin A
Vit. A
Vitamin E
Vit. E
Vitamin B1
Vit. B1
Vitamin B2
Vit. B2
Vitamin B3
Vit. B3
Vitamin B5
Vit. B5
Vitamin B6
Vit. B6
Vitamin B12
Vit. B12
Vitamin K
Vit. K
Folate
Folate
28%
0%
68%
0%
4.3%
399%
41%
54%
62%
675%
0%
18%
6
100 g
300 g
1 fillet - 60g 3 oz - 85g
Vitamin C
Vit. C
Vitamin D
Vit. D
Vitamin A
Vit. A
Vitamin E
Vit. E
Vitamin B1
Vit. B1
Vitamin B2
Vit. B2
Vitamin B3
Vit. B3
Vitamin B5
Vit. B5
Vitamin B6
Vit. B6
Vitamin B12
Vit. B12
Vitamin K
Vit. K
Folate
Folate
0%
20%
5.7%
5.6%
14%
51%
74%
26%
76%
458%
0.25%
2.3%
All nutrients comparison - raw data values
Nutrient
DV% diff.
Iron
10.84mg
0.56mg
129%
Vitamin B2
1.729mg
0.223mg
116%
Copper
0.998mg
0.06mg
104%
Selenium
89.6µg
44.1µg
83%
Vitamin B12
5.4µg
3.66µg
73%
Cholesterol
224mg
86mg
46%
Phosphorus
580mg
267mg
45%
Zinc
3.46mg
0.57mg
26%
Vitamin A
203µg
17µg
21%
Protein
32.48g
23.48g
18%
Choline
91.6mg
17%
Sodium
744mg
419mg
14%
Calcium
180mg
72mg
11%
Vitamin B3
2.189mg
3.949mg
11%
Vitamin C
8.5mg
0mg
9%
Vitamin B5
0.9mg
0.432mg
9%
Manganese
0.209mg
0.018mg
8%
Vitamin D
1.3µg
7%
Vitamin D*
51 IU
6%
Potassium
637mg
430mg
6%
Magnesium
60mg
81mg
5%
Vitamin B6
0.27mg
0.329mg
5%
Folate
24µg
3µg
5%
Vitamin B1
0.017mg
0.054mg
3%
Calories
158kcal
111kcal
2%
Vitamin E
0.28mg
2%
Polyunsaturated fat
0.268g
0.583g
2%
Carbs
1.64g
0g
1%
Protein per 100 calories
21g
21g
N/A
Calories per 10 g protein
49kcal
47kcal
N/A
Weight per 100 calories
63g
90g
N/A
Fats
1.4g
1.18g
0%
Net carbs
1.64g
0g
N/A
Vitamin K
0.1µg
0%
Saturated fat
0.236g
0.159g
0%
Monounsaturated fat
0.162g
0.134g
0%
Tryptophan
0.364mg
0.263mg
0%
Threonine
1.398mg
1.029mg
0%
Isoleucine
1.414mg
1.082mg
0%
Leucine
2.287mg
1.908mg
0%
Lysine
2.427mg
2.157mg
0%
Methionine
0.733mg
0.696mg
0%
Phenylalanine
1.164mg
0.917mg
0%
Valine
1.419mg
1.21mg
0%
Histidine
0.624mg
0.691mg
0%
Omega-3 - EPA
0.078g
0.086g
N/A
Omega-3 - DHA
0.132g
0.423g
N/A
Omega-3 - DPA
0.012g
0.027g
N/A
Macronutrient Comparison
Macronutrient breakdown side-by-side comparison
4
32%
61%
3%
Protein:
32.48 g
Fats:
1.4 g
Carbs:
1.64 g
Water:
61.12 g
Other:
3.36 g
1
23%
74%
2%
Protein:
23.48 g
Fats:
1.18 g
Carbs:
0 g
Water:
73.65 g
Other:
1.69 g
Contains
more
Protein Protein
+38.3%
Contains
more
Fats Fats
+18.6%
Contains
more
Carbs Carbs
+∞%
Contains
more
Other Other
+98.8%
Contains
more
Water Water
+20.5%
Fat Type Comparison
Fat type breakdown side-by-side comparison
1
35%
24%
40%
Saturated fat:
Sat. Fat
0.236 g
Monounsaturated fat:
Mono. Fat
0.162 g
Polyunsaturated fat:
Poly. Fat
0.268 g
2
18%
15%
67%
Saturated fat:
Sat. Fat
0.159 g
Monounsaturated fat:
Mono. Fat
0.134 g
Polyunsaturated fat:
Poly. Fat
0.583 g
Contains
more
Mono. Fat Monounsaturated fat
+20.9%
Contains
less
Sat. Fat Saturated fat
-32.6%
Contains
more
Poly. Fat Polyunsaturated fat
+117.5%