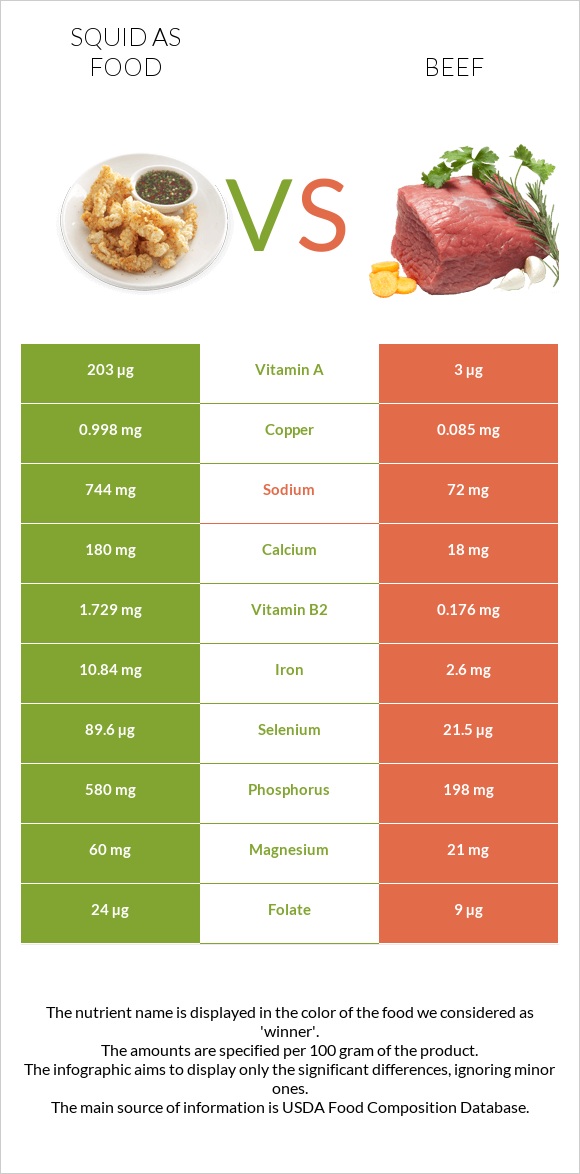
What are the main differences between squid and beef? Squid is richer in selenium, vitamin B2, copper, iron, vitamin B12, and phosphorus, while beef is higher in vitamin B6 and vitamin B3. Squid's daily need coverage for selenium is 117% higher. Beef has 14 times less sodium than squid. Squid has 744mg of sodium, while beef has 54mg. We used Mollusks, cuttlefish, mixed species, cooked, moist heat and Beef, loin, tenderloin roast, separable lean only, boneless, trimmed to 0" fat, select, cooked, roasted types in this comparison.
Infographic
Mineral Comparison
Mineral comparison score is based on the number of minerals by which one or the other food is richer. The "coverage" charts below show how much of the daily needs can be covered by 300 grams of the food.
8
100 g
300 g
3 oz - 85g
Magnesium
Magnesium
Calcium
Calcium
Potassium
Potassium
Iron
Iron
Copper
Copper
Zinc
Zinc
Phosphorus
Phosphorus
Sodium
Sodium
Manganese
Manganese
Selenium
Selenium
43%
54%
56%
407%
333%
94%
249%
97%
27%
489%
1
100 g
300 g
3 oz - 85g 1 roast - 487g
Magnesium
Magnesium
Calcium
Calcium
Potassium
Potassium
Iron
Iron
Copper
Copper
Zinc
Zinc
Phosphorus
Phosphorus
Sodium
Sodium
Manganese
Manganese
Selenium
Selenium
10%
3.9%
31%
114%
32%
101%
111%
7%
1.2%
139%
Vitamin Comparison
Vitamin comparison score is based on the number of vitamins by which one or the other food is richer. The "coverage" charts below show how much of the daily needs can be covered by 300 grams of the food.
6
100 g
300 g
3 oz - 85g
Vitamin C
Vit. C
Vitamin D
Vit. D
Vitamin A
Vit. A
Vitamin E
Vit. E
Vitamin B1
Vit. B1
Vitamin B2
Vit. B2
Vitamin B3
Vit. B3
Vitamin B5
Vit. B5
Vitamin B6
Vit. B6
Vitamin B12
Vit. B12
Vitamin K
Vit. K
Folate
Folate
28%
0%
68%
0%
4.3%
399%
41%
54%
62%
675%
0%
18%
6
100 g
300 g
3 oz - 85g 1 roast - 487g
Vitamin C
Vit. C
Vitamin D
Vit. D
Vitamin A
Vit. A
Vitamin E
Vit. E
Vitamin B1
Vit. B1
Vitamin B2
Vit. B2
Vitamin B3
Vit. B3
Vitamin B5
Vit. B5
Vitamin B6
Vit. B6
Vitamin B12
Vit. B12
Vitamin K
Vit. K
Folate
Folate
0%
1.5%
0.67%
5%
19%
92%
108%
29%
154%
526%
4%
5.3%
All nutrients comparison - raw data values
Nutrient
DV% diff.
Selenium
89.6µg
25.4µg
117%
Vitamin B2
1.729mg
0.4mg
102%
Copper
0.998mg
0.097mg
100%
Iron
10.84mg
3.04mg
98%
Vitamin B12
5.4µg
4.21µg
50%
Cholesterol
224mg
85mg
46%
Phosphorus
580mg
259mg
46%
Vitamin B6
0.27mg
0.669mg
31%
Sodium
744mg
54mg
30%
Vitamin A
203µg
2µg
22%
Vitamin B3
2.189mg
5.76mg
22%
Calcium
180mg
13mg
17%
Choline
75.6mg
14%
Magnesium
60mg
14mg
11%
Saturated fat
0.236g
2.595g
11%
Protein
32.48g
27.55g
10%
Vitamin C
8.5mg
0mg
9%
Manganese
0.209mg
0.009mg
9%
Fats
1.4g
6.54g
8%
Potassium
637mg
352mg
8%
Vitamin B5
0.9mg
0.481mg
8%
Monounsaturated fat
0.162g
2.734g
6%
Vitamin B1
0.017mg
0.074mg
5%
Folate
24µg
7µg
4%
Zinc
3.46mg
3.7mg
2%
Vitamin E
0.25mg
2%
Polyunsaturated fat
0.268g
0.532g
2%
Calories
158kcal
169kcal
1%
Carbs
1.64g
0g
1%
Vitamin D
0.1µg
1%
Vitamin K
1.6µg
1%
Protein per 100 calories
21g
16g
N/A
Calories per 10 g protein
49kcal
61kcal
N/A
Weight per 100 calories
63g
59g
N/A
Unsaturated / Saturated Fat ratio
1.8
1.3
N/A
Net carbs
1.64g
0g
N/A
Vitamin D*
3 IU
0%
Trans fat
0.375g
N/A
Tryptophan
0.364mg
0.359mg
0%
Threonine
1.398mg
1.534mg
0%
Isoleucine
1.414mg
1.52mg
0%
Leucine
2.287mg
2.833mg
0%
Lysine
2.427mg
3.178mg
0%
Methionine
0.733mg
0.871mg
0%
Phenylalanine
1.164mg
1.299mg
0%
Valine
1.419mg
1.603mg
0%
Histidine
0.624mg
1.244mg
0%
Omega-3 - EPA
0.078g
0.002g
N/A
Omega-3 - DHA
0.132g
0.002g
N/A
Omega-3 - ALA
0.013g
N/A
Omega-3 - DPA
0.012g
0.011g
N/A
Omega-6 - Dihomo-gamma-linoleic acid
0.017g
N/A
Omega-6 - Eicosadienoic acid
0.002g
N/A
Omega-6 - Linoleic acid
0.349g
N/A
Macronutrient Comparison
Macronutrient breakdown side-by-side comparison
3
32%
61%
3%
Protein:
32.48 g
Fats:
1.4 g
Carbs:
1.64 g
Water:
61.12 g
Other:
3.36 g
2
28%
7%
66%
Protein:
27.55 g
Fats:
6.54 g
Carbs:
0 g
Water:
65.71 g
Other:
0.2 g
Contains
more
Protein Protein
+17.9%
Contains
more
Carbs Carbs
+∞%
Contains
more
Other Other
+1580%
Contains
more
Fats Fats
+367.1%
Fat Type Comparison
Fat type breakdown side-by-side comparison
1
35%
24%
40%
Saturated fat:
Sat. Fat
0.236 g
Monounsaturated fat:
Mono. Fat
0.162 g
Polyunsaturated fat:
Poly. Fat
0.268 g
2
44%
47%
9%
Saturated fat:
Sat. Fat
2.595 g
Monounsaturated fat:
Mono. Fat
2.734 g
Polyunsaturated fat:
Poly. Fat
0.532 g
Contains
less
Sat. Fat Saturated fat
-90.9%
Contains
more
Mono. Fat Monounsaturated fat
+1587.7%
Contains
more
Poly. Fat Polyunsaturated fat
+98.5%