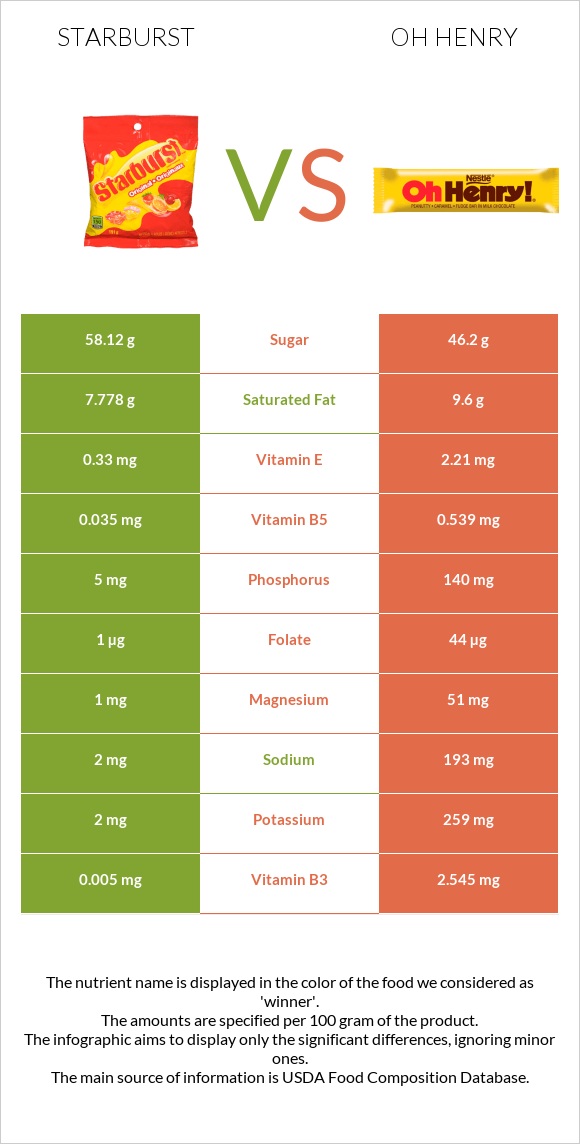
The main differences between starburst and oh henry Starburst is richer in vitamin C, yet oh henry is richer in copper, manganese, phosphorus, vitamin B3, vitamin E, vitamin B1, magnesium, zinc, and folate. Daily need coverage for vitamin C for starburst is 65% higher. Food types used in this article are Candies, MARS SNACKFOOD US, STARBURST Fruit Chews, Original fruits and Candies, NESTLE, OH HENRY! Bar .
Infographic
Mineral Comparison
Mineral comparison score is based on the number of minerals by which one or the other food is richer. The "coverage" charts below show how much of the daily needs can be covered by 300 grams of the food.
1
100 g
300 g
1 piece - 5g 1 serving fun size (8 chews) - 40g 1 serving 2.07 oz pack - 59g
Magnesium
Magnesium
Calcium
Calcium
Potassium
Potassium
Iron
Iron
Copper
Copper
Zinc
Zinc
Phosphorus
Phosphorus
Sodium
Sodium
Manganese
Manganese
Selenium
Selenium
0.71%
0%
0.18%
0.38%
4%
0%
2.1%
0.26%
2%
4.4%
9
100 g
300 g
1 serving fun size bar - 26g 1 bar 2 oz - 57g
Magnesium
Magnesium
Calcium
Calcium
Potassium
Potassium
Iron
Iron
Copper
Copper
Zinc
Zinc
Phosphorus
Phosphorus
Sodium
Sodium
Manganese
Manganese
Selenium
Selenium
36%
21%
23%
19%
118%
32%
60%
25%
70%
17%
Vitamin Comparison
Vitamin comparison score is based on the number of vitamins by which one or the other food is richer. The "coverage" charts below show how much of the daily needs can be covered by 300 grams of the food.
2
100 g
300 g
1 piece - 5g 1 serving fun size (8 chews) - 40g 1 serving 2.07 oz pack - 59g
Vitamin C
Vit. C
Vitamin D
Vit. D
Vitamin A
Vit. A
Vitamin E
Vit. E
Vitamin B1
Vit. B1
Vitamin B2
Vit. B2
Vitamin B3
Vit. B3
Vitamin B5
Vit. B5
Vitamin B6
Vit. B6
Vitamin B12
Vit. B12
Vitamin K
Vit. K
Folate
Folate
196%
0%
0%
6.6%
0.25%
0.46%
0.09%
2.1%
0%
0%
5.3%
0.75%
8
100 g
300 g
1 serving fun size bar - 26g 1 bar 2 oz - 57g
Vitamin C
Vit. C
Vitamin D
Vit. D
Vitamin A
Vit. A
Vitamin E
Vit. E
Vitamin B1
Vit. B1
Vitamin B2
Vit. B2
Vitamin B3
Vit. B3
Vitamin B5
Vit. B5
Vitamin B6
Vit. B6
Vitamin B12
Vit. B12
Vitamin K
Vit. K
Folate
Folate
0%
0%
0%
44%
37%
28%
48%
32%
20%
25%
3%
33%
All nutrients comparison - raw data values
Nutrient
DV% diff.
Vitamin C
58.7mg
0mg
65%
Copper
0.012mg
0.353mg
38%
Fats
8.21g
23g
23%
Manganese
0.015mg
0.535mg
23%
Phosphorus
5mg
140mg
19%
Polyunsaturated fat
0g
2.706g
18%
Vitamin B3
0.005mg
2.545mg
16%
Protein
0.41g
7.7g
15%
Monounsaturated fat
0g
5.53g
14%
Vitamin E
0.33mg
2.21mg
13%
Magnesium
1mg
51mg
12%
Vitamin B1
0.001mg
0.149mg
12%
Zinc
0mg
1.19mg
11%
Folate
1µg
44µg
11%
Vitamin B5
0.035mg
0.539mg
10%
Vitamin B2
0.002mg
0.121mg
9%
Potassium
2mg
259mg
8%
Fiber
0g
1.9g
8%
Sodium
2mg
193mg
8%
Vitamin B12
0µg
0.2µg
8%
Saturated fat
7.778g
9.6g
8%
Calcium
0mg
69mg
7%
Vitamin B6
0mg
0.086mg
7%
Choline
0mg
37.1mg
7%
Carbs
82.57g
65.5g
6%
Iron
0.01mg
0.5mg
6%
Selenium
0.8µg
3.2µg
4%
Calories
408kcal
462kcal
3%
Cholesterol
0mg
7mg
2%
Vitamin K
2.1µg
1.2µg
1%
Caffeine
0mg
4mg
1%
Protein per 100 calories
0.1g
1.7g
N/A
Calories per 10 g protein
9951kcal
600kcal
N/A
Weight per 100 calories
25g
22g
N/A
Unsaturated / Saturated Fat ratio
0
0.86
N/A
Net carbs
82.57g
63.6g
N/A
Sugar
58.12g
46.2g
N/A
Trans fat
0.141g
0.05g
N/A
Macronutrient Comparison
Macronutrient breakdown side-by-side comparison
2
8%
83%
9%
Protein:
0.41 g
Fats:
8.21 g
Carbs:
82.57 g
Water:
8.51 g
Other:
0.3 g
3
8%
23%
66%
2%
Protein:
7.7 g
Fats:
23 g
Carbs:
65.5 g
Water:
2.3 g
Other:
1.5 g
Contains
more
Carbs Carbs
+26.1%
Contains
more
Water Water
+270%
Contains
more
Protein Protein
+1778%
Contains
more
Fats Fats
+180.1%
Contains
more
Other Other
+400%
Fat Type Comparison
Fat type breakdown side-by-side comparison
1
100%
Saturated fat:
Sat. Fat
7.778 g
Monounsaturated fat:
Mono. Fat
0 g
Polyunsaturated fat:
Poly. Fat
0 g
2
54%
31%
15%
Saturated fat:
Sat. Fat
9.6 g
Monounsaturated fat:
Mono. Fat
5.53 g
Polyunsaturated fat:
Poly. Fat
2.706 g
Contains
less
Sat. Fat Saturated fat
-19%
Contains
more
Mono. Fat Monounsaturated fat
+∞%
Contains
more
Poly. Fat Polyunsaturated fat
+∞%