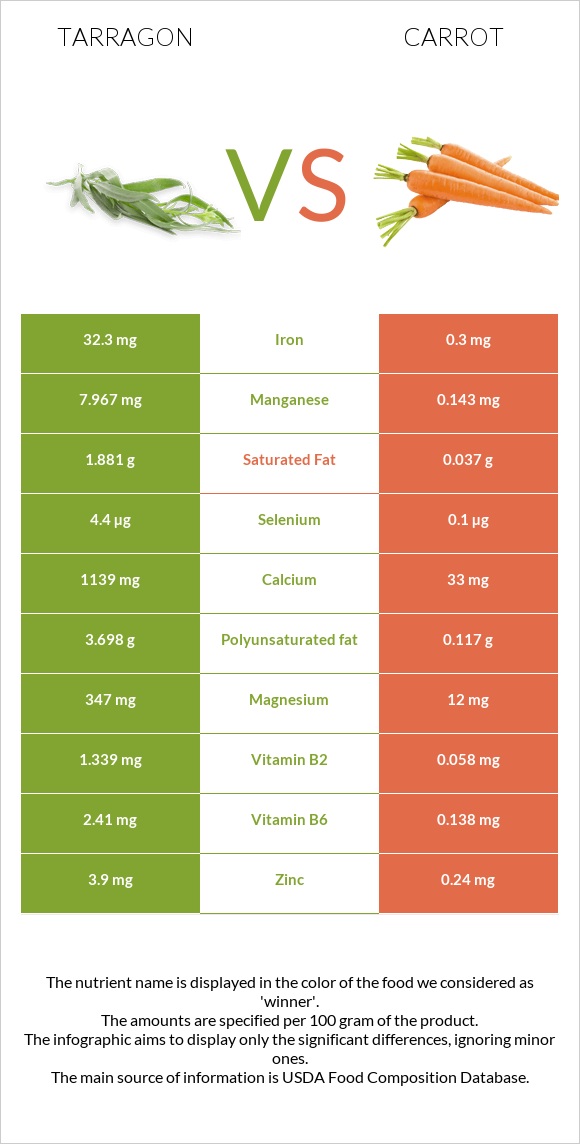
A recap on the differences between tarragon and carrots Tarragon has more iron, manganese, vitamin B6, calcium, vitamin B2, magnesium, potassium, copper, and folate; however, carrots are higher in vitamin A. Tarragon covers your daily iron needs 400% more than carrots. Carrots contain 56 times less manganese than tarragon. Tarragon contains 7.967mg of manganese, while carrots contain 0.143mg. The glycemic index of carrots is higher. Food varieties used in this article are Spices, tarragon, dried and Carrots, raw .
Infographic
Mineral Comparison
Mineral comparison score is based on the number of minerals by which one or the other food is richer. The "coverage" charts below show how much of the daily needs can be covered by 300 grams of the food.
10
100 g
300 g
0.25 tsp - 0.5g 1 tsp, ground - 1.6g 1 tbsp, leaves - 1.8g 1 tbsp, ground - 4.8g
Magnesium
Magnesium
Calcium
Calcium
Potassium
Potassium
Iron
Iron
Copper
Copper
Zinc
Zinc
Phosphorus
Phosphorus
Sodium
Sodium
Manganese
Manganese
Selenium
Selenium
248%
342%
266%
1211%
226%
106%
134%
8.1%
1039%
24%
0
100 g
300 g
1 slice - 3g 1 strip medium - 4g 1 strip large (3" long) - 7g 1 small (5-1/2" long) - 50g 1 medium - 61g 1 large (7-1/4" to 8-/1/2" long) - 72g 1 cup grated - 110g 1 cup strips or slices - 122g 1 cup chopped - 128g
Magnesium
Magnesium
Calcium
Calcium
Potassium
Potassium
Iron
Iron
Copper
Copper
Zinc
Zinc
Phosphorus
Phosphorus
Sodium
Sodium
Manganese
Manganese
Selenium
Selenium
8.6%
9.9%
28%
11%
15%
6.5%
15%
9%
19%
0.55%
Vitamin Comparison
Vitamin comparison score is based on the number of vitamins by which one or the other food is richer. The "coverage" charts below show how much of the daily needs can be covered by 300 grams of the food.
6
100 g
300 g
0.25 tsp - 0.5g 1 tsp, ground - 1.6g 1 tbsp, leaves - 1.8g 1 tbsp, ground - 4.8g
Vitamin C
Vit. C
Vitamin D
Vit. D
Vitamin A
Vit. A
Vitamin E
Vit. E
Vitamin B1
Vit. B1
Vitamin B2
Vit. B2
Vitamin B3
Vit. B3
Vitamin B5
Vit. B5
Vitamin B6
Vit. B6
Vitamin B12
Vit. B12
Vitamin K
Vit. K
Folate
Folate
167%
0%
70%
0%
63%
309%
168%
0%
556%
0%
0%
206%
4
100 g
300 g
1 slice - 3g 1 strip medium - 4g 1 strip large (3" long) - 7g 1 small (5-1/2" long) - 50g 1 medium - 61g 1 large (7-1/4" to 8-/1/2" long) - 72g 1 cup grated - 110g 1 cup strips or slices - 122g 1 cup chopped - 128g
Vitamin C
Vit. C
Vitamin D
Vit. D
Vitamin A
Vit. A
Vitamin E
Vit. E
Vitamin B1
Vit. B1
Vitamin B2
Vit. B2
Vitamin B3
Vit. B3
Vitamin B5
Vit. B5
Vitamin B6
Vit. B6
Vitamin B12
Vit. B12
Vitamin K
Vit. K
Folate
Folate
20%
0%
278%
13%
17%
13%
18%
16%
32%
0%
33%
14%
All nutrients comparison - raw data values
Nutrient
DV% diff.
Iron
32.3mg
0.3mg
400%
Manganese
7.967mg
0.143mg
340%
Vitamin B6
2.41mg
0.138mg
175%
Calcium
1139mg
33mg
111%
Vitamin B2
1.339mg
0.058mg
99%
Magnesium
347mg
12mg
80%
Potassium
3020mg
320mg
79%
Copper
0.677mg
0.045mg
70%
Vitamin A
210µg
835µg
69%
Folate
274µg
19µg
64%
Vitamin B3
8.95mg
0.983mg
50%
Vitamin C
50mg
5.9mg
49%
Protein
22.77g
0.93g
44%
Phosphorus
313mg
35mg
40%
Zinc
3.9mg
0.24mg
33%
Polyunsaturated fat
3.698g
0.117g
24%
Fiber
7.4g
2.8g
18%
Vitamin B1
0.251mg
0.066mg
15%
Carbs
50.22g
9.58g
14%
Calories
295kcal
41kcal
13%
Fats
7.24g
0.24g
11%
Vitamin K
13.2µg
11%
Selenium
4.4µg
0.1µg
8%
Saturated fat
1.881g
0.037g
8%
Vitamin B5
0.273mg
5%
Vitamin E
0.66mg
4%
Choline
8.8mg
2%
Starch
1.43g
1%
Monounsaturated fat
0.474g
0.014g
1%
Fructose
0.55g
1%
Protein per 100 calories
7.7g
2.3g
N/A
Calories per 10 g protein
130kcal
441kcal
N/A
Weight per 100 calories
34g
244g
N/A
Unsaturated / Saturated Fat ratio
2.2
3.5
N/A
Net carbs
42.82g
6.78g
N/A
Sugar
4.74g
N/A
Sodium
62mg
69mg
0%
Tryptophan
0.012mg
0%
Threonine
0.191mg
0%
Isoleucine
0.077mg
0%
Leucine
0.102mg
0%
Lysine
0.101mg
0%
Methionine
0.02mg
0%
Phenylalanine
0.061mg
0%
Valine
0.069mg
0%
Histidine
0.04mg
0%
Macronutrient Comparison
Macronutrient breakdown side-by-side comparison
4
23%
7%
50%
8%
12%
Protein:
22.77 g
Fats:
7.24 g
Carbs:
50.22 g
Water:
7.74 g
Other:
12.03 g
1
10%
88%
Protein:
0.93 g
Fats:
0.24 g
Carbs:
9.58 g
Water:
88.29 g
Other:
0.96 g
Contains
more
Protein Protein
+2348.4%
Contains
more
Fats Fats
+2916.7%
Contains
more
Carbs Carbs
+424.2%
Contains
more
Other Other
+1153.1%
Contains
more
Water Water
+1040.7%
Fat Type Comparison
Fat type breakdown side-by-side comparison
2
31%
8%
61%
Saturated fat:
Sat. Fat
1.881 g
Monounsaturated fat:
Mono. Fat
0.474 g
Polyunsaturated fat:
Poly. Fat
3.698 g
1
22%
8%
70%
Saturated fat:
Sat. Fat
0.037 g
Monounsaturated fat:
Mono. Fat
0.014 g
Polyunsaturated fat:
Poly. Fat
0.117 g
Contains
more
Mono. Fat Monounsaturated fat
+3285.7%
Contains
more
Poly. Fat Polyunsaturated fat
+3060.7%
Contains
less
Sat. Fat Saturated fat
-98%