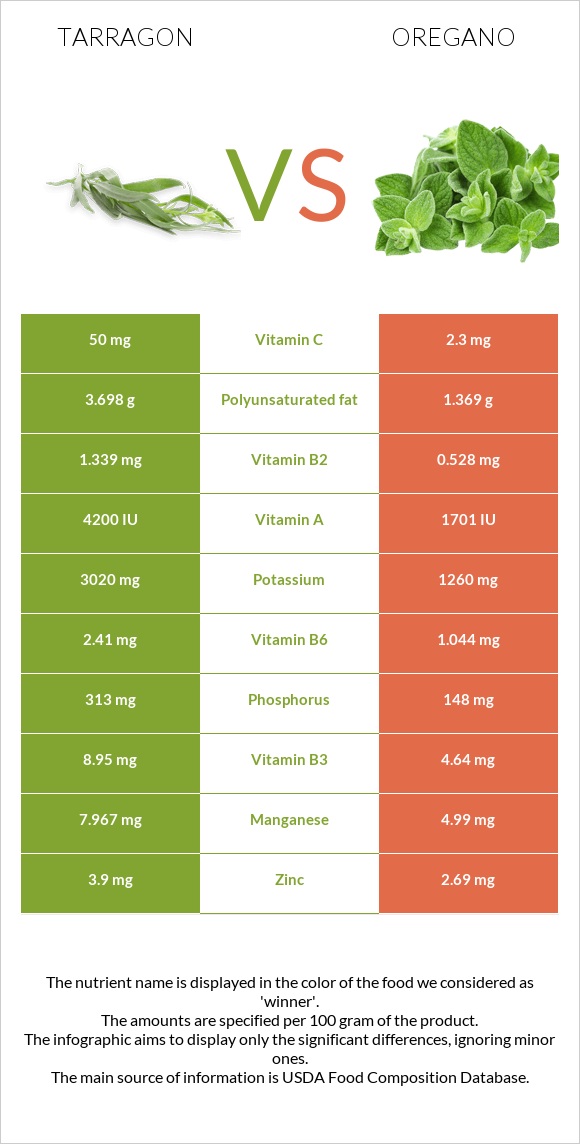
How are tarragon and oregano different? Tarragon is richer in manganese, vitamin B6, vitamin B2, vitamin C, potassium, vitamin A, and vitamin B3, while oregano is higher in fiber, iron, and calcium. Oregano covers your daily need for fiber, 140% more than tarragon. Tarragon contains 22 times more vitamin C than oregano. Tarragon contains 50mg of vitamin C, while oregano contains 2.3mg. Spices, tarragon, dried and Spices, oregano, dried types were used in this article.
Infographic
Mineral Comparison
Mineral comparison score is based on the number of minerals by which one or the other food is richer. The "coverage" charts below show how much of the daily needs can be covered by 300 grams of the food.
5
100 g
300 g
0.25 tsp - 0.5g 1 tsp, ground - 1.6g 1 tbsp, leaves - 1.8g 1 tbsp, ground - 4.8g
Magnesium
Magnesium
Calcium
Calcium
Potassium
Potassium
Iron
Iron
Copper
Copper
Zinc
Zinc
Phosphorus
Phosphorus
Sodium
Sodium
Manganese
Manganese
Selenium
Selenium
248%
342%
266%
1211%
226%
106%
134%
8.1%
1039%
24%
3
100 g
300 g
0.25 tsp - 0.5g 1 tsp, ground - 1.8g
Magnesium
Magnesium
Calcium
Calcium
Potassium
Potassium
Iron
Iron
Copper
Copper
Zinc
Zinc
Phosphorus
Phosphorus
Sodium
Sodium
Manganese
Manganese
Selenium
Selenium
193%
479%
111%
1380%
211%
73%
63%
3.3%
651%
25%
Vitamin Comparison
Vitamin comparison score is based on the number of vitamins by which one or the other food is richer. The "coverage" charts below show how much of the daily needs can be covered by 300 grams of the food.
7
100 g
300 g
0.25 tsp - 0.5g 1 tsp, ground - 1.6g 1 tbsp, leaves - 1.8g 1 tbsp, ground - 4.8g
Vitamin C
Vit. C
Vitamin D
Vit. D
Vitamin A
Vit. A
Vitamin E
Vit. E
Vitamin B1
Vit. B1
Vitamin B2
Vit. B2
Vitamin B3
Vit. B3
Vitamin B5
Vit. B5
Vitamin B6
Vit. B6
Vitamin B12
Vit. B12
Vitamin K
Vit. K
Folate
Folate
167%
0%
70%
0%
63%
309%
168%
0%
556%
0%
0%
206%
3
100 g
300 g
0.25 tsp - 0.5g 1 tsp, ground - 1.8g
Vitamin C
Vit. C
Vitamin D
Vit. D
Vitamin A
Vit. A
Vitamin E
Vit. E
Vitamin B1
Vit. B1
Vitamin B2
Vit. B2
Vitamin B3
Vit. B3
Vitamin B5
Vit. B5
Vitamin B6
Vit. B6
Vitamin B12
Vit. B12
Vitamin K
Vit. K
Folate
Folate
7.7%
0%
28%
365%
44%
122%
87%
55%
241%
0%
1554%
178%
All nutrients comparison - raw data values
Nutrient
DV% diff.
Vitamin K
621.7µg
518%
Fiber
7.4g
42.5g
140%
Manganese
7.967mg
4.99mg
129%
Vitamin E
18.26mg
122%
Vitamin B6
2.41mg
1.044mg
105%
Vitamin B2
1.339mg
0.528mg
62%
Iron
32.3mg
36.8mg
56%
Vitamin C
50mg
2.3mg
53%
Potassium
3020mg
1260mg
52%
Calcium
1139mg
1597mg
46%
Protein
22.77g
9g
28%
Vitamin B3
8.95mg
4.64mg
27%
Phosphorus
313mg
148mg
24%
Magnesium
347mg
270mg
18%
Vitamin B5
0.921mg
18%
Polyunsaturated fat
3.698g
1.369g
16%
Vitamin A
210µg
85µg
14%
Zinc
3.9mg
2.69mg
11%
Folate
274µg
237µg
9%
Carbs
50.22g
68.92g
6%
Vitamin B1
0.251mg
0.177mg
6%
Choline
32.3mg
6%
Fats
7.24g
4.28g
5%
Copper
0.677mg
0.633mg
5%
Calories
295kcal
265kcal
2%
Sodium
62mg
25mg
2%
Saturated fat
1.881g
1.551g
2%
Monounsaturated fat
0.474g
0.716g
1%
Fructose
1.13g
1%
Protein per 100 calories
7.7g
3.4g
N/A
Calories per 10 g protein
130kcal
294kcal
N/A
Weight per 100 calories
34g
38g
N/A
Unsaturated / Saturated Fat ratio
2.2
1.3
N/A
Net carbs
42.82g
26.42g
N/A
Sugar
4.09g
N/A
Selenium
4.4µg
4.5µg
0%
Tryptophan
0.203mg
0%
Threonine
0.322mg
0%
Isoleucine
0.441mg
0%
Leucine
0.78mg
0%
Lysine
0.5mg
0%
Methionine
0.127mg
0%
Phenylalanine
0.449mg
0%
Valine
0.585mg
0%
Histidine
0.144mg
0%
Omega-3 - ALA
0.621g
N/A
Macronutrient Comparison
Macronutrient breakdown side-by-side comparison
3
23%
7%
50%
8%
12%
Protein:
22.77 g
Fats:
7.24 g
Carbs:
50.22 g
Water:
7.74 g
Other:
12.03 g
2
9%
4%
69%
10%
8%
Protein:
9 g
Fats:
4.28 g
Carbs:
68.92 g
Water:
9.93 g
Other:
7.87 g
Contains
more
Protein Protein
+153%
Contains
more
Fats Fats
+69.2%
Contains
more
Other Other
+52.9%
Contains
more
Carbs Carbs
+37.2%
Contains
more
Water Water
+28.3%
Fat Type Comparison
Fat type breakdown side-by-side comparison
1
31%
8%
61%
Saturated fat:
Sat. Fat
1.881 g
Monounsaturated fat:
Mono. Fat
0.474 g
Polyunsaturated fat:
Poly. Fat
3.698 g
2
43%
20%
38%
Saturated fat:
Sat. Fat
1.551 g
Monounsaturated fat:
Mono. Fat
0.716 g
Polyunsaturated fat:
Poly. Fat
1.369 g
Contains
more
Poly. Fat Polyunsaturated fat
+170.1%
Contains
less
Sat. Fat Saturated fat
-17.5%
Contains
more
Mono. Fat Monounsaturated fat
+51.1%