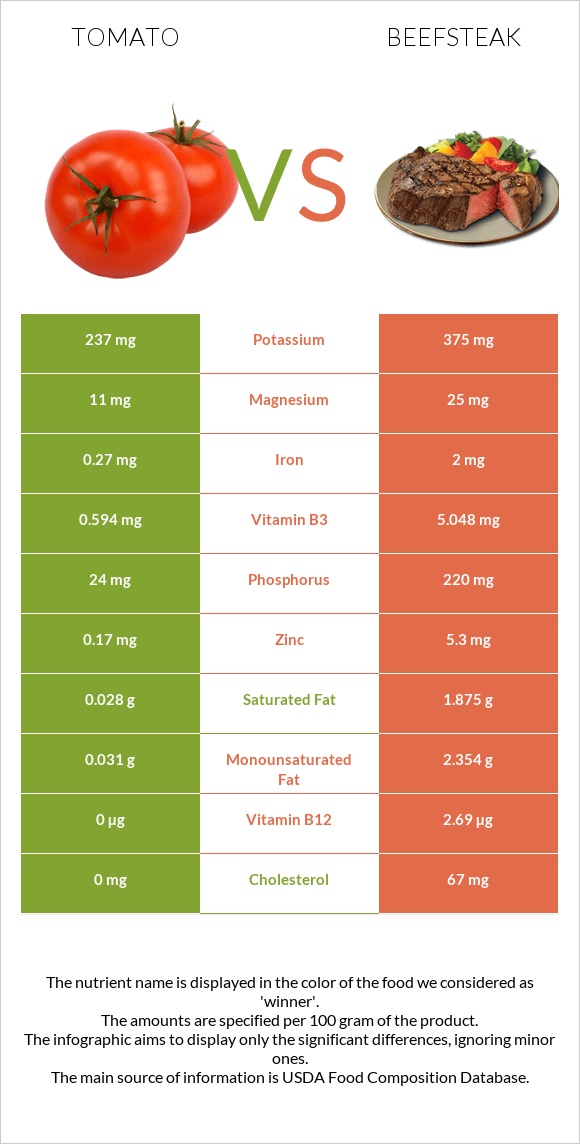
Summary of differences between tomatoes and beefsteak Tomatoes have less vitamin B12, selenium, zinc, vitamin B3, vitamin B6, phosphorus, choline, and iron than beefsteak. Beefsteak covers your daily need for vitamin B12, 58% more than tomatoes. Tomatoes have less saturated fat. The glycemic index of tomatoes is higher. These are the specific foods used in this comparison Tomatoes, red, ripe, raw, year round average and Beef, loin, top loin, separable lean, and fat, trimmed to 1/8" fat, select, cooked, grilled .
Infographic
Mineral Comparison
Mineral comparison score is based on the number of minerals by which one or the other food is richer. The "coverage" charts below show how much of the daily needs can be covered by 300 grams of the food.
2
100 g
300 g
1 slice, thin/small - 15g 1 cherry - 17g 1 slice, medium (1/4" thick) - 20g 1 slice, thick/large (1/2" thick) - 27g 1 wedge (1/4 of medium tomato) - 31g 1 Italian tomato - 62g 1 plum tomato - 62g 1 small whole (2-2/5" dia) - 91g 1 medium whole (2-3/5" dia) - 123g 1 NLEA serving - 148g 1 cup cherry tomatoes - 149g 1 cup, chopped or sliced - 180g 1 large whole (3" dia) - 182g
Magnesium
Magnesium
Calcium
Calcium
Potassium
Potassium
Iron
Iron
Copper
Copper
Zinc
Zinc
Phosphorus
Phosphorus
Sodium
Sodium
Manganese
Manganese
Selenium
Selenium
7.9%
3%
21%
10%
20%
4.6%
10%
0.65%
15%
0%
8
100 g
300 g
3 oz - 85g
Magnesium
Magnesium
Calcium
Calcium
Potassium
Potassium
Iron
Iron
Copper
Copper
Zinc
Zinc
Phosphorus
Phosphorus
Sodium
Sodium
Manganese
Manganese
Selenium
Selenium
16%
6.6%
30%
61%
24%
132%
91%
7.4%
1.2%
157%
Vitamin Comparison
Vitamin comparison score is based on the number of vitamins by which one or the other food is richer. The "coverage" charts below show how much of the daily needs can be covered by 300 grams of the food.
5
100 g
300 g
1 slice, thin/small - 15g 1 cherry - 17g 1 slice, medium (1/4" thick) - 20g 1 slice, thick/large (1/2" thick) - 27g 1 wedge (1/4 of medium tomato) - 31g 1 Italian tomato - 62g 1 plum tomato - 62g 1 small whole (2-2/5" dia) - 91g 1 medium whole (2-3/5" dia) - 123g 1 NLEA serving - 148g 1 cup cherry tomatoes - 149g 1 cup, chopped or sliced - 180g 1 large whole (3" dia) - 182g
Vitamin C
Vit. C
Vitamin D
Vit. D
Vitamin A
Vit. A
Vitamin E
Vit. E
Vitamin B1
Vit. B1
Vitamin B2
Vit. B2
Vitamin B3
Vit. B3
Vitamin B5
Vit. B5
Vitamin B6
Vit. B6
Vitamin B12
Vit. B12
Vitamin K
Vit. K
Folate
Folate
46%
0%
14%
11%
9.3%
4.4%
11%
5.3%
18%
0%
20%
11%
6
100 g
300 g
3 oz - 85g
Vitamin C
Vit. C
Vitamin D
Vit. D
Vitamin A
Vit. A
Vitamin E
Vit. E
Vitamin B1
Vit. B1
Vitamin B2
Vit. B2
Vitamin B3
Vit. B3
Vitamin B5
Vit. B5
Vitamin B6
Vit. B6
Vitamin B12
Vit. B12
Vitamin K
Vit. K
Folate
Folate
0%
0%
0%
9%
20%
32%
131%
32%
135%
173%
4%
6%
All nutrients comparison - raw data values
Nutrient
DV% diff.
Vitamin B12
0µg
1.38µg
58%
Protein
0.88g
26.72g
52%
Selenium
0µg
28.8µg
52%
Zinc
0.17mg
4.85mg
43%
Vitamin B3
0.594mg
6.978mg
40%
Vitamin B6
0.08mg
0.585mg
39%
Phosphorus
24mg
213mg
27%
Saturated fat
0.028g
5.951g
27%
Cholesterol
0mg
79mg
26%
Fats
0.2g
15.11g
23%
Iron
0.27mg
1.63mg
17%
Choline
6.7mg
101.8mg
17%
Monounsaturated fat
0.031g
6.298g
16%
Vitamin C
13.7mg
0mg
15%
Calories
18kcal
250kcal
12%
Vitamin B2
0.019mg
0.14mg
9%
Vitamin B5
0.089mg
0.527mg
9%
Fiber
1.2g
0g
5%
Vitamin A
42µg
0µg
5%
Manganese
0.114mg
0.009mg
5%
Vitamin K
7.9µg
1.6µg
5%
Magnesium
11mg
23mg
3%
Potassium
237mg
340mg
3%
Vitamin B1
0.037mg
0.078mg
3%
Polyunsaturated fat
0.083g
0.56g
3%
Copper
0.059mg
0.073mg
2%
Sodium
5mg
57mg
2%
Folate
15µg
8µg
2%
Fructose
1.37g
2%
Carbs
3.89g
0g
1%
Calcium
10mg
22mg
1%
Vitamin E
0.54mg
0.45mg
1%
Protein per 100 calories
4.9g
11g
N/A
Calories per 10 g protein
205kcal
94kcal
N/A
Weight per 100 calories
556g
40g
N/A
Unsaturated / Saturated Fat ratio
4.1
1.2
N/A
Net carbs
2.69g
0g
N/A
Sugar
2.63g
0g
N/A
Tryptophan
0.006mg
0.173mg
0%
Threonine
0.027mg
1.054mg
0%
Isoleucine
0.018mg
1.201mg
0%
Leucine
0.025mg
2.099mg
0%
Lysine
0.027mg
2.23mg
0%
Methionine
0.006mg
0.687mg
0%
Phenylalanine
0.027mg
1.042mg
0%
Valine
0.018mg
1.309mg
0%
Histidine
0.014mg
0.842mg
0%
Macronutrient Comparison
Macronutrient breakdown side-by-side comparison
3
4%
95%
Protein:
0.88 g
Fats:
0.2 g
Carbs:
3.89 g
Water:
94.52 g
Other:
0.51 g
2
27%
15%
58%
Protein:
26.72 g
Fats:
15.11 g
Carbs:
0 g
Water:
57.96 g
Other:
0.21 g
Contains
more
Carbs Carbs
+∞%
Contains
more
Water Water
+63.1%
Contains
more
Other Other
+142.9%
Contains
more
Protein Protein
+2936.4%
Contains
more
Fats Fats
+7455%
Fat Type Comparison
Fat type breakdown side-by-side comparison
1
20%
22%
58%
Saturated fat:
Sat. Fat
0.028 g
Monounsaturated fat:
Mono. Fat
0.031 g
Polyunsaturated fat:
Poly. Fat
0.083 g
2
46%
49%
4%
Saturated fat:
Sat. Fat
5.951 g
Monounsaturated fat:
Mono. Fat
6.298 g
Polyunsaturated fat:
Poly. Fat
0.56 g
Contains
less
Sat. Fat Saturated fat
-99.5%
Contains
more
Mono. Fat Monounsaturated fat
+20216.1%
Contains
more
Poly. Fat Polyunsaturated fat
+574.7%