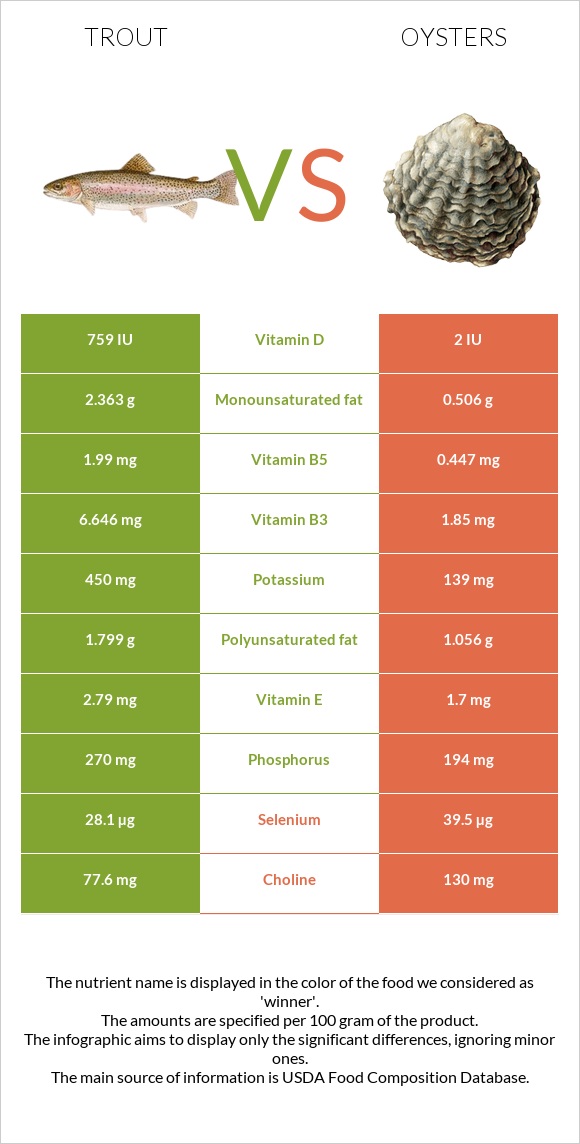
Significant differences between trout and oysters Trout has more vitamin D*, vitamin B5, vitamin B3, and vitamin B6; however, oysters is richer in zinc, copper, vitamin B12, iron, manganese, and selenium. Oysters covers your daily zinc needs 710% more than trout. Oysters has 380 times less vitamin D* than trout. Trout has 759 IU of vitamin D*, while oysters has 2 IU. Specific food types used in this comparison are Fish, trout, rainbow, farmed, cooked, dry heat and Mollusks, oyster, eastern, wild, cooked, moist heat .
Infographic
Mineral Comparison
Mineral comparison score is based on the number of minerals by which one or the other food is richer. The "coverage" charts below show how much of the daily needs can be covered by 300 grams of the food.
3
100 g
300 g
1 fillet - 71g 3 oz - 85g
Magnesium
Magnesium
Calcium
Calcium
Potassium
Potassium
Iron
Iron
Copper
Copper
Zinc
Zinc
Phosphorus
Phosphorus
Sodium
Sodium
Manganese
Manganese
Selenium
Selenium
21%
9%
40%
14%
18%
15%
116%
8%
1.7%
153%
7
100 g
300 g
6 medium - 42g 3 oz - 85g
Magnesium
Magnesium
Calcium
Calcium
Potassium
Potassium
Iron
Iron
Copper
Copper
Zinc
Zinc
Phosphorus
Phosphorus
Sodium
Sodium
Manganese
Manganese
Selenium
Selenium
25%
35%
12%
345%
1902%
2144%
83%
22%
77%
215%
Vitamin Comparison
Vitamin comparison score is based on the number of vitamins by which one or the other food is richer. The "coverage" charts below show how much of the daily needs can be covered by 300 grams of the food.
8
100 g
300 g
1 fillet - 71g 3 oz - 85g
Vitamin C
Vit. C
Vitamin D
Vit. D
Vitamin A
Vit. A
Vitamin E
Vit. E
Vitamin B1
Vit. B1
Vitamin B2
Vit. B2
Vitamin B3
Vit. B3
Vitamin B5
Vit. B5
Vitamin B6
Vit. B6
Vitamin B12
Vit. B12
Vitamin K
Vit. K
Folate
Folate
9.7%
285%
33%
56%
36%
25%
125%
119%
89%
514%
0.25%
9%
4
100 g
300 g
6 medium - 42g 3 oz - 85g
Vitamin C
Vit. C
Vitamin D
Vit. D
Vitamin A
Vit. A
Vitamin E
Vit. E
Vitamin B1
Vit. B1
Vitamin B2
Vit. B2
Vitamin B3
Vit. B3
Vitamin B5
Vit. B5
Vitamin B6
Vit. B6
Vitamin B12
Vit. B12
Vitamin K
Vit. K
Folate
Folate
0%
0%
8.7%
34%
9%
42%
35%
27%
14%
2188%
5%
11%
All nutrients comparison - raw data values
Nutrient
DV% diff.
Zinc
0.54mg
78.6mg
710%
Copper
0.055mg
5.707mg
628%
Vitamin B12
4.11µg
17.5µg
558%
Iron
0.36mg
9.21mg
111%
Vitamin D*
759 IU
2 IU
95%
Vitamin D
19µg
0µg
95%
Vitamin B5
1.99mg
0.447mg
31%
Vitamin B3
6.646mg
1.85mg
30%
Protein
23.8g
11.42g
25%
Manganese
0.013mg
0.591mg
25%
Vitamin B6
0.386mg
0.061mg
25%
Selenium
28.1µg
39.5µg
21%
Phosphorus
270mg
194mg
11%
Choline
77.6mg
130mg
10%
Calcium
30mg
116mg
9%
Potassium
450mg
139mg
9%
Vitamin B1
0.143mg
0.036mg
9%
Vitamin A
100µg
26µg
8%
Vitamin E
2.79mg
1.7mg
7%
Fats
7.38g
3.42g
6%
Vitamin B2
0.107mg
0.18mg
6%
Sodium
61mg
166mg
5%
Monounsaturated fat
2.363g
0.506g
5%
Polyunsaturated fat
1.799g
1.056g
5%
Calories
168kcal
102kcal
3%
Vitamin C
2.9mg
0mg
3%
Cholesterol
70mg
79mg
3%
Saturated fat
1.651g
0.948g
3%
Carbs
0g
5.45g
2%
Vitamin K
0.1µg
2µg
2%
Magnesium
30mg
35mg
1%
Folate
12µg
14µg
1%
Protein per 100 calories
14g
11g
N/A
Calories per 10 g protein
71kcal
89kcal
N/A
Weight per 100 calories
60g
98g
N/A
Unsaturated / Saturated Fat ratio
2.5
1.6
N/A
Net carbs
0g
5.45g
N/A
Sugar
0g
1.23g
N/A
Starch
0.9g
0%
Trans fat
0.056g
0.068g
N/A
Tryptophan
0.279mg
0.138mg
0%
Threonine
1.092mg
0.046mg
0%
Isoleucine
1.148mg
0.459mg
0%
Leucine
2.025mg
0.716mg
0%
Lysine
2.287mg
0.762mg
0%
Methionine
0.738mg
0.257mg
0%
Phenylalanine
0.973mg
0.413mg
0%
Valine
1.283mg
0.523mg
0%
Histidine
0.733mg
0.22mg
0%
Omega-3 - EPA
0.259g
0.353g
N/A
Omega-3 - DHA
0.616g
0.271g
N/A
Omega-3 - ALA
0.163g
N/A
Omega-3 - DPA
0.109g
0.02g
N/A
Omega-3 - Eicosatrienoic acid
0.004g
N/A
Omega-6 - Gamma-linoleic acid
0.004g
N/A
Omega-6 - Dihomo-gamma-linoleic acid
0.007g
N/A
Omega-6 - Eicosadienoic acid
0.047g
0.007g
N/A
Omega-6 - Linoleic acid
0.061g
N/A
Macronutrient Comparison
Macronutrient breakdown side-by-side comparison
2
24%
7%
69%
Protein:
23.8 g
Fats:
7.38 g
Carbs:
0 g
Water:
68.72 g
Other:
0.1 g
3
11%
3%
5%
78%
Protein:
11.42 g
Fats:
3.42 g
Carbs:
5.45 g
Water:
78.19 g
Other:
1.52 g
Contains
more
Protein Protein
+108.4%
Contains
more
Fats Fats
+115.8%
Contains
more
Carbs Carbs
+∞%
Contains
more
Water Water
+13.8%
Contains
more
Other Other
+1420%
Fat Type Comparison
Fat type breakdown side-by-side comparison
2
28%
41%
31%
Saturated fat:
Sat. Fat
1.651 g
Monounsaturated fat:
Mono. Fat
2.363 g
Polyunsaturated fat:
Poly. Fat
1.799 g
1
38%
20%
42%
Saturated fat:
Sat. Fat
0.948 g
Monounsaturated fat:
Mono. Fat
0.506 g
Polyunsaturated fat:
Poly. Fat
1.056 g
Contains
more
Mono. Fat Monounsaturated fat
+367%
Contains
more
Poly. Fat Polyunsaturated fat
+70.4%
Contains
less
Sat. Fat Saturated fat
-42.6%