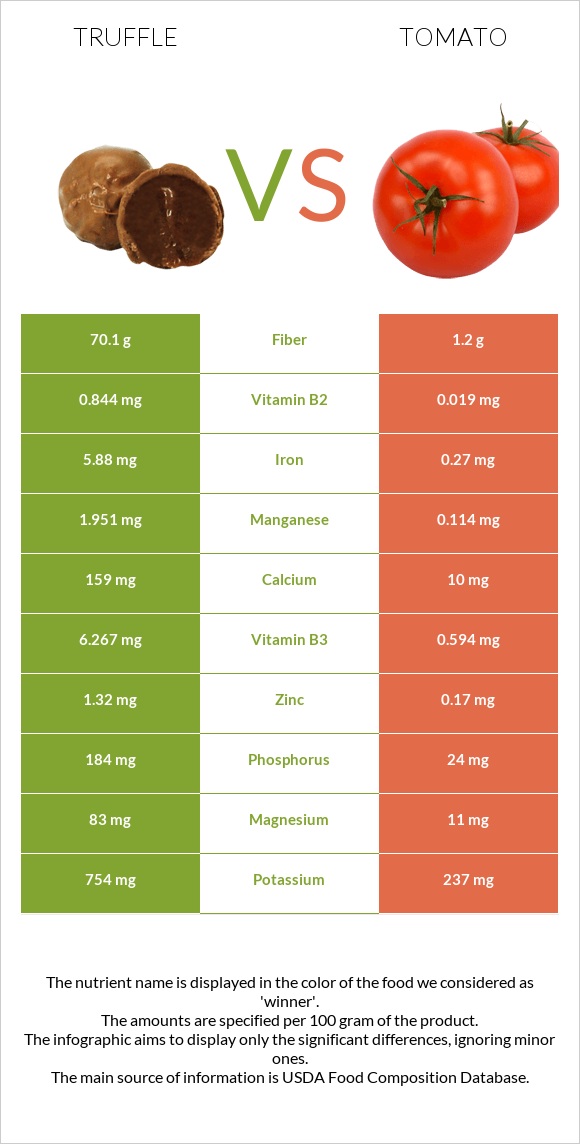
What are the differences between truffle and tomatoes? Truffle is higher in fiber, manganese, selenium, iron, vitamin B2, vitamin B3, phosphorus, and magnesium; however, tomatoes are richer in vitamin A and vitamin C. Truffle's daily need coverage for fiber is 276% more. Tomatoes have a lower glycemic index (23) than truffle (45). We used Fungi, Cloud ears, dried and Tomatoes, red, ripe, raw, year round average types in this article.
Infographic
Mineral Comparison
Mineral comparison score is based on the number of minerals by which one or the other food is richer. The "coverage" charts below show how much of the daily needs can be covered by 300 grams of the food.
9
100 g
300 g
1 piece - 4.5g 1 cup - 28g
Magnesium
Magnesium
Calcium
Calcium
Potassium
Potassium
Iron
Iron
Copper
Copper
Zinc
Zinc
Phosphorus
Phosphorus
Sodium
Sodium
Manganese
Manganese
Selenium
Selenium
59%
48%
67%
221%
61%
36%
79%
4.6%
254%
237%
1
100 g
300 g
1 slice, thin/small - 15g 1 cherry - 17g 1 slice, medium (1/4" thick) - 20g 1 slice, thick/large (1/2" thick) - 27g 1 wedge (1/4 of medium tomato) - 31g 1 Italian tomato - 62g 1 plum tomato - 62g 1 small whole (2-2/5" dia) - 91g 1 medium whole (2-3/5" dia) - 123g 1 NLEA serving - 148g 1 cup cherry tomatoes - 149g 1 cup, chopped or sliced - 180g 1 large whole (3" dia) - 182g
Magnesium
Magnesium
Calcium
Calcium
Potassium
Potassium
Iron
Iron
Copper
Copper
Zinc
Zinc
Phosphorus
Phosphorus
Sodium
Sodium
Manganese
Manganese
Selenium
Selenium
7.9%
3%
21%
10%
20%
4.6%
10%
0.65%
15%
0%
Vitamin Comparison
Vitamin comparison score is based on the number of vitamins by which one or the other food is richer. The "coverage" charts below show how much of the daily needs can be covered by 300 grams of the food.
5
100 g
300 g
1 piece - 4.5g 1 cup - 28g
Vitamin C
Vit. C
Vitamin D
Vit. D
Vitamin A
Vit. A
Vitamin E
Vit. E
Vitamin B1
Vit. B1
Vitamin B2
Vit. B2
Vitamin B3
Vit. B3
Vitamin B5
Vit. B5
Vitamin B6
Vit. B6
Vitamin B12
Vit. B12
Vitamin K
Vit. K
Folate
Folate
0%
0%
0%
0%
3.8%
195%
118%
29%
26%
0%
0%
29%
5
100 g
300 g
1 slice, thin/small - 15g 1 cherry - 17g 1 slice, medium (1/4" thick) - 20g 1 slice, thick/large (1/2" thick) - 27g 1 wedge (1/4 of medium tomato) - 31g 1 Italian tomato - 62g 1 plum tomato - 62g 1 small whole (2-2/5" dia) - 91g 1 medium whole (2-3/5" dia) - 123g 1 NLEA serving - 148g 1 cup cherry tomatoes - 149g 1 cup, chopped or sliced - 180g 1 large whole (3" dia) - 182g
Vitamin C
Vit. C
Vitamin D
Vit. D
Vitamin A
Vit. A
Vitamin E
Vit. E
Vitamin B1
Vit. B1
Vitamin B2
Vit. B2
Vitamin B3
Vit. B3
Vitamin B5
Vit. B5
Vitamin B6
Vit. B6
Vitamin B12
Vit. B12
Vitamin K
Vit. K
Folate
Folate
46%
0%
14%
11%
9.3%
4.4%
11%
5.3%
18%
0%
20%
11%
All nutrients comparison - raw data values
Nutrient
DV% diff.
Fiber
70.1g
1.2g
276%
Manganese
1.951mg
0.114mg
80%
Selenium
43.4µg
0µg
79%
Iron
5.88mg
0.27mg
70%
Vitamin B2
0.844mg
0.019mg
63%
Vitamin B3
6.267mg
0.594mg
35%
Carbs
73.01g
3.89g
23%
Phosphorus
184mg
24mg
23%
Protein
9.25g
0.88g
17%
Magnesium
83mg
11mg
17%
Vitamin C
0mg
13.7mg
15%
Calcium
159mg
10mg
15%
Potassium
754mg
237mg
15%
Copper
0.183mg
0.059mg
14%
Calories
284kcal
18kcal
13%
Zinc
1.32mg
0.17mg
10%
Vitamin B5
0.481mg
0.089mg
8%
Vitamin K
7.9µg
7%
Folate
38µg
15µg
6%
Vitamin A
0µg
42µg
5%
Vitamin E
0.54mg
4%
Vitamin B1
0.015mg
0.037mg
2%
Vitamin B6
0.112mg
0.08mg
2%
Fructose
1.37g
2%
Fats
0.73g
0.2g
1%
Sodium
35mg
5mg
1%
Choline
6.7mg
1%
Polyunsaturated fat
0.083g
1%
Protein per 100 calories
3.3g
4.9g
N/A
Calories per 10 g protein
307kcal
205kcal
N/A
Weight per 100 calories
35g
556g
N/A
Net carbs
2.91g
2.69g
N/A
Sugar
2.63g
N/A
Saturated fat
0.028g
0%
Monounsaturated fat
0.031g
0%
Tryptophan
0.006mg
0%
Threonine
0.027mg
0%
Isoleucine
0.018mg
0%
Leucine
0.025mg
0%
Lysine
0.027mg
0%
Methionine
0.006mg
0%
Phenylalanine
0.027mg
0%
Valine
0.018mg
0%
Histidine
0.014mg
0%
Macronutrient Comparison
Macronutrient breakdown side-by-side comparison
4
9%
73%
15%
2%
Protein:
9.25 g
Fats:
0.73 g
Carbs:
73.01 g
Water:
14.8 g
Other:
2.21 g
1
4%
95%
Protein:
0.88 g
Fats:
0.2 g
Carbs:
3.89 g
Water:
94.52 g
Other:
0.51 g
Contains
more
Protein Protein
+951.1%
Contains
more
Fats Fats
+265%
Contains
more
Carbs Carbs
+1776.9%
Contains
more
Other Other
+333.3%
Contains
more
Water Water
+538.6%