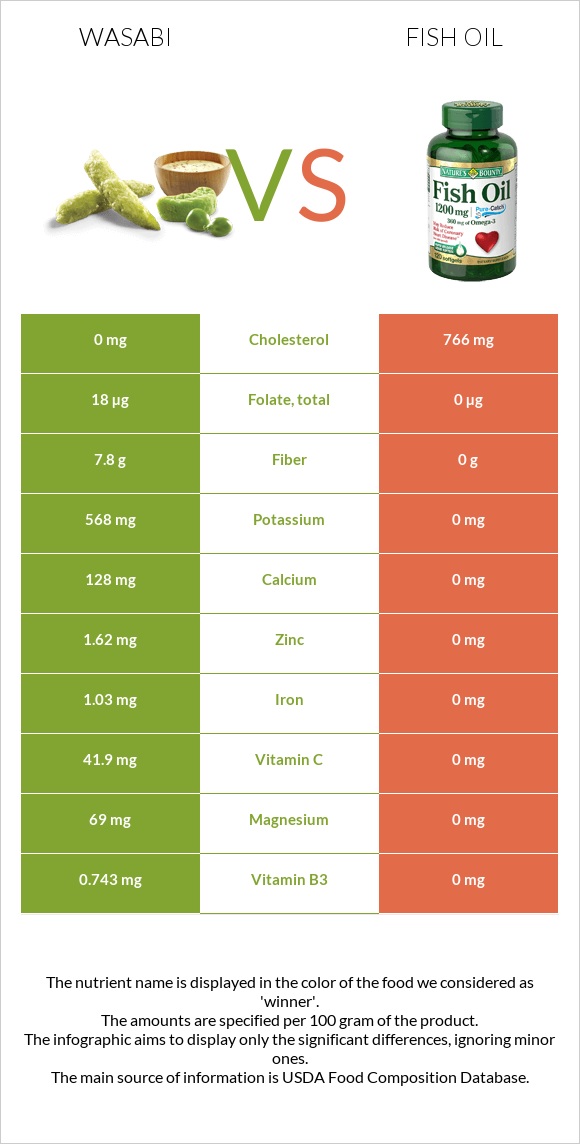
The main differences between wasabi and fish oil Wasabi has more vitamin C, fiber, vitamin B6, copper, manganese, potassium, magnesium, and zinc; however, fish oil has more vitamin D*. Daily need coverage for cholesterol for fish oil is 237% higher. Wasabi has a higher glycemic index than fish oil. Food types used in this article are Wasabi, root, raw and Fish oil, sardine .
Infographic
Mineral Comparison
Mineral comparison score is based on the number of minerals by which one or the other food is richer. The "coverage" charts below show how much of the daily needs can be covered by 300 grams of the food.
8
100 g
300 g
1 cup, sliced - 130g 1 root - 169g
Magnesium
Magnesium
Calcium
Calcium
Potassium
Potassium
Iron
Iron
Copper
Copper
Zinc
Zinc
Phosphorus
Phosphorus
Sodium
Sodium
Manganese
Manganese
Selenium
Selenium
49%
38%
50%
39%
52%
44%
34%
2.2%
51%
0%
1
100 g
300 g
1 tsp - 4.5g 1 tbsp - 13.6g 1 cup - 218g
Magnesium
Magnesium
Calcium
Calcium
Potassium
Potassium
Iron
Iron
Copper
Copper
Zinc
Zinc
Phosphorus
Phosphorus
Sodium
Sodium
Manganese
Manganese
Selenium
Selenium
0%
0%
0%
0%
0%
0%
0%
0%
0%
0%
Vitamin Comparison
Vitamin comparison score is based on the number of vitamins by which one or the other food is richer. The "coverage" charts below show how much of the daily needs can be covered by 300 grams of the food.
8
100 g
300 g
1 cup, sliced - 130g 1 root - 169g
Vitamin C
Vit. C
Vitamin D
Vit. D
Vitamin A
Vit. A
Vitamin E
Vit. E
Vitamin B1
Vit. B1
Vitamin B2
Vit. B2
Vitamin B3
Vit. B3
Vitamin B5
Vit. B5
Vitamin B6
Vit. B6
Vitamin B12
Vit. B12
Vitamin K
Vit. K
Folate
Folate
140%
0%
0.67%
0%
33%
26%
14%
12%
63%
0%
0%
14%
1
100 g
300 g
1 tsp - 4.5g 1 tbsp - 13.6g 1 cup - 218g
Vitamin C
Vit. C
Vitamin D
Vit. D
Vitamin A
Vit. A
Vitamin E
Vit. E
Vitamin B1
Vit. B1
Vitamin B2
Vit. B2
Vitamin B3
Vit. B3
Vitamin B5
Vit. B5
Vitamin B6
Vit. B6
Vitamin B12
Vit. B12
Vitamin K
Vit. K
Folate
Folate
0%
125%
0%
0%
0%
0%
0%
0%
0%
0%
0%
0%
All nutrients comparison - raw data values
Nutrient
DV% diff.
Cholesterol
0mg
710mg
237%
Polyunsaturated fat
31.867g
212%
Fats
0.63g
100g
153%
Saturated fat
29.892g
136%
Monounsaturated fat
33.841g
85%
Vitamin C
41.9mg
0mg
47%
Vitamin D*
0 IU
332 IU
42%
Vitamin D
0µg
8.3µg
42%
Calories
109kcal
902kcal
40%
Fiber
7.8g
0g
31%
Vitamin B6
0.274mg
0mg
21%
Potassium
568mg
0mg
17%
Copper
0.155mg
0mg
17%
Manganese
0.391mg
0mg
17%
Magnesium
69mg
0mg
16%
Zinc
1.62mg
0mg
15%
Calcium
128mg
0mg
13%
Iron
1.03mg
0mg
13%
Phosphorus
80mg
0mg
11%
Vitamin B1
0.131mg
0mg
11%
Protein
4.8g
0g
10%
Vitamin B2
0.114mg
0mg
9%
Carbs
23.54g
0g
8%
Vitamin B3
0.743mg
0mg
5%
Folate
18µg
0µg
5%
Vitamin B5
0.203mg
0mg
4%
Sodium
17mg
0mg
1%
Protein per 100 calories
4.4g
0g
N/A
Calories per 10 g protein
227kcal
N/A
Weight per 100 calories
92g
11g
N/A
Unsaturated / Saturated Fat ratio
2.2
N/A
Net carbs
15.74g
0g
N/A
Vitamin A
2µg
0µg
0%
Omega-3 - EPA
10.137g
N/A
Omega-3 - DHA
10.656g
N/A
Omega-3 - DPA
1.973g
N/A
Macronutrient Comparison
Macronutrient breakdown side-by-side comparison
4
5%
24%
69%
2%
Protein:
4.8 g
Fats:
0.63 g
Carbs:
23.54 g
Water:
69.11 g
Other:
1.92 g
1
100%
Protein:
0 g
Fats:
100 g
Carbs:
0 g
Water:
0 g
Other:
0 g
Contains
more
Protein Protein
+∞%
Contains
more
Carbs Carbs
+∞%
Contains
more
Water Water
+∞%
Contains
more
Other Other
+∞%
Contains
more
Fats Fats
+15773%