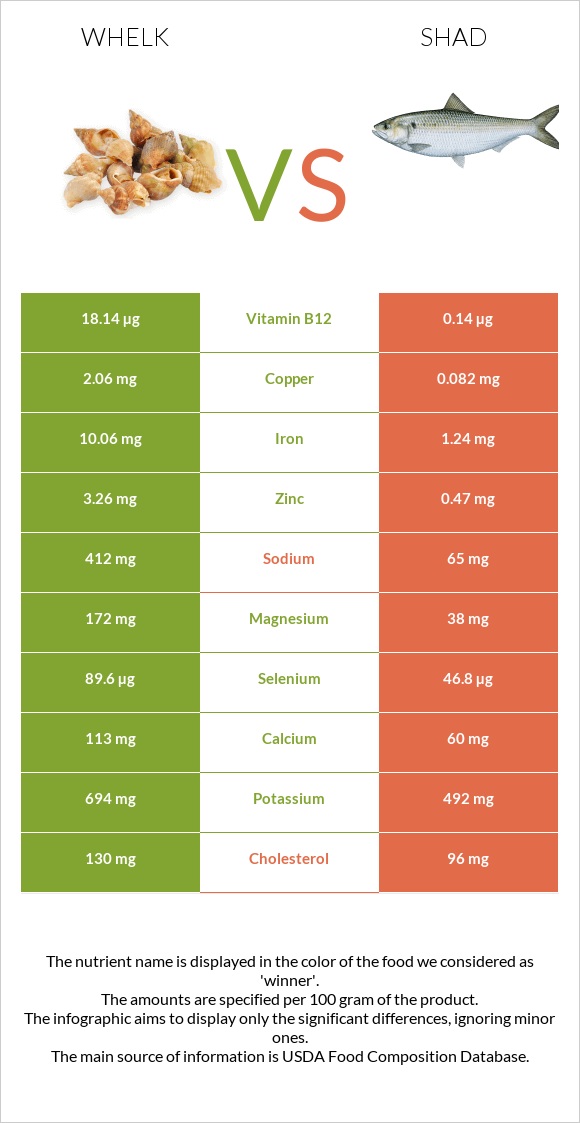
Summary of differences between whelk and shad Whelk has more vitamin B12, copper, iron, selenium, manganese, magnesium, zinc, and vitamin B6; however, shad is higher in vitamin B3. Whelk covers your daily need for vitamin B12, 750% more than shad. Whelk has 25 times more copper than shad. While whelk has 2.06mg of copper, shad has only 0.082mg. Shad has less sodium. These are the specific foods used in this comparison Mollusks, whelk, unspecified, cooked, moist heat and Fish, shad, american, cooked, dry heat .
Infographic
Mineral Comparison
Mineral comparison score is based on the number of minerals by which one or the other food is richer. The "coverage" charts below show how much of the daily needs can be covered by 300 grams of the food.
8
100 g
300 g
3 oz - 85g
Magnesium
Magnesium
Calcium
Calcium
Potassium
Potassium
Iron
Iron
Copper
Copper
Zinc
Zinc
Phosphorus
Phosphorus
Sodium
Sodium
Manganese
Manganese
Selenium
Selenium
123%
34%
61%
377%
687%
89%
121%
54%
116%
489%
2
100 g
300 g
3 oz - 85g 1 fillet - 144g
Magnesium
Magnesium
Calcium
Calcium
Potassium
Potassium
Iron
Iron
Copper
Copper
Zinc
Zinc
Phosphorus
Phosphorus
Sodium
Sodium
Manganese
Manganese
Selenium
Selenium
27%
18%
43%
47%
27%
13%
150%
8.5%
7%
255%
Vitamin Comparison
Vitamin comparison score is based on the number of vitamins by which one or the other food is richer. The "coverage" charts below show how much of the daily needs can be covered by 300 grams of the food.
4
100 g
300 g
3 oz - 85g
Vitamin C
Vit. C
Vitamin D
Vit. D
Vitamin A
Vit. A
Vitamin E
Vit. E
Vitamin B1
Vit. B1
Vitamin B2
Vit. B2
Vitamin B3
Vit. B3
Vitamin B5
Vit. B5
Vitamin B6
Vit. B6
Vitamin B12
Vit. B12
Vitamin K
Vit. K
Folate
Folate
23%
0%
16%
0%
12%
49%
37%
24%
150%
2268%
0%
8.3%
5
100 g
300 g
3 oz - 85g 1 fillet - 144g
Vitamin C
Vit. C
Vitamin D
Vit. D
Vitamin A
Vit. A
Vitamin E
Vit. E
Vitamin B1
Vit. B1
Vitamin B2
Vit. B2
Vitamin B3
Vit. B3
Vitamin B5
Vit. B5
Vitamin B6
Vit. B6
Vitamin B12
Vit. B12
Vitamin K
Vit. K
Folate
Folate
0%
0%
12%
0%
46%
71%
202%
52%
107%
18%
0%
13%
All nutrients comparison - raw data values
Nutrient
DV% diff.
Vitamin B12
18.14µg
0.14µg
750%
Copper
2.06mg
0.082mg
220%
Iron
10.06mg
1.24mg
110%
Selenium
89.6µg
46.8µg
78%
Vitamin B3
1.995mg
10.769mg
55%
Protein
47.68g
21.71g
52%
Manganese
0.89mg
0.054mg
36%
Magnesium
172mg
38mg
32%
Fats
0.8g
17.65g
26%
Zinc
3.26mg
0.47mg
25%
Sodium
412mg
65mg
15%
Vitamin B6
0.65mg
0.462mg
14%
Cholesterol
130mg
96mg
11%
Vitamin B1
0.049mg
0.183mg
11%
Phosphorus
282mg
349mg
10%
Vitamin B5
0.4mg
0.865mg
9%
Vitamin C
6.8mg
0mg
8%
Vitamin B2
0.214mg
0.308mg
7%
Potassium
694mg
492mg
6%
Carbs
15.52g
0g
5%
Calcium
113mg
60mg
5%
Folate
11µg
17µg
2%
Calories
275kcal
252kcal
1%
Vitamin A
49µg
36µg
1%
Protein per 100 calories
17g
8.6g
N/A
Calories per 10 g protein
58kcal
116kcal
N/A
Weight per 100 calories
36g
40g
N/A
Unsaturated / Saturated Fat ratio
1.6
N/A
Net carbs
15.52g
0g
N/A
Saturated fat
0.062g
0%
Monounsaturated fat
0.056g
0%
Polyunsaturated fat
0.046g
0%
Tryptophan
0.618mg
0.243mg
0%
Threonine
2.136mg
0.952mg
0%
Isoleucine
1.655mg
1mg
0%
Leucine
3.807mg
1.764mg
0%
Lysine
2.93mg
1.993mg
0%
Methionine
1.205mg
0.642mg
0%
Phenylalanine
1.648mg
0.847mg
0%
Valine
2.075mg
1.118mg
0%
Histidine
0.977mg
0.639mg
0%
Omega-3 - EPA
0.008g
N/A
Omega-3 - DHA
0.012g
N/A
Macronutrient Comparison
Macronutrient breakdown side-by-side comparison
3
48%
16%
32%
4%
Protein:
47.68 g
Fats:
0.8 g
Carbs:
15.52 g
Water:
32 g
Other:
4 g
2
22%
18%
59%
Protein:
21.71 g
Fats:
17.65 g
Carbs:
0 g
Water:
59.22 g
Other:
1.42 g
Contains
more
Protein Protein
+119.6%
Contains
more
Carbs Carbs
+∞%
Contains
more
Other Other
+181.7%
Contains
more
Fats Fats
+2106.3%
Contains
more
Water Water
+85.1%