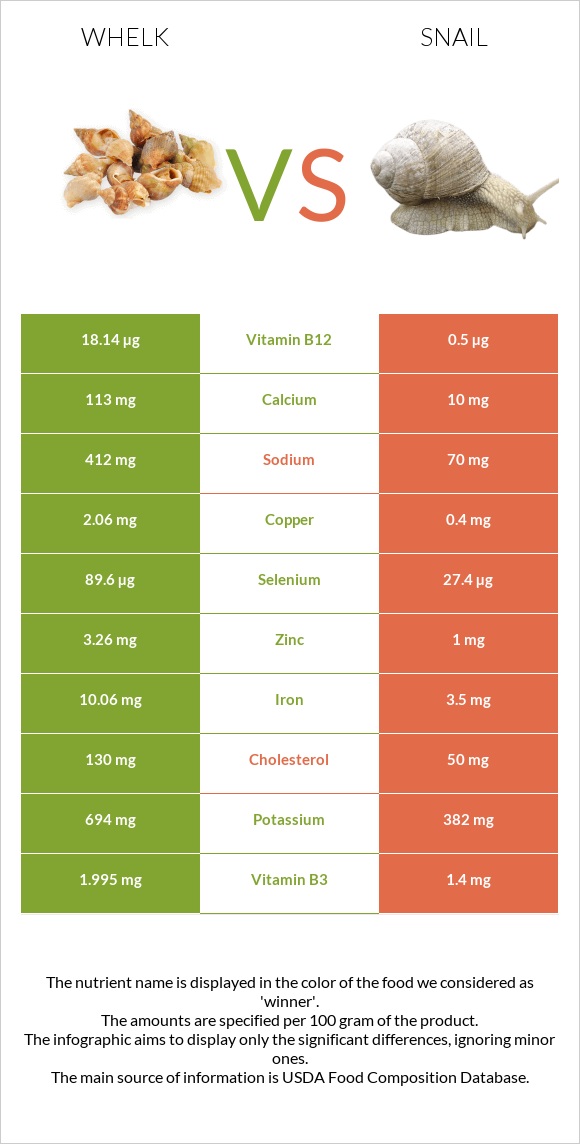
How are whelk and snail different? Whelk is richer in vitamin B12, copper, selenium, iron, vitamin B6, zinc, and calcium, while snail is higher in magnesium. Whelk covers your daily need for vitamin B12, 735% more than snail. Whelk contains 11 times more calcium than snail. Whelk contains 113mg of calcium, while snail contains 10mg. Snail is lower in sodium. Mollusks, whelk, unspecified, cooked, moist heat and Mollusks, snail, raw types were used in this article.
Infographic
Mineral Comparison
Mineral comparison score is based on the number of minerals by which one or the other food is richer. The "coverage" charts below show how much of the daily needs can be covered by 300 grams of the food.
7
100 g
300 g
3 oz - 85g
Magnesium
Magnesium
Calcium
Calcium
Potassium
Potassium
Iron
Iron
Copper
Copper
Zinc
Zinc
Phosphorus
Phosphorus
Sodium
Sodium
Manganese
Manganese
Selenium
Selenium
123%
34%
61%
377%
687%
89%
121%
54%
116%
489%
2
100 g
300 g
3 oz - 85g
Magnesium
Magnesium
Calcium
Calcium
Potassium
Potassium
Iron
Iron
Copper
Copper
Zinc
Zinc
Phosphorus
Phosphorus
Sodium
Sodium
Manganese
Manganese
Selenium
Selenium
179%
3%
34%
131%
133%
27%
117%
9.1%
0%
149%
Vitamin Comparison
Vitamin comparison score is based on the number of vitamins by which one or the other food is richer. The "coverage" charts below show how much of the daily needs can be covered by 300 grams of the food.
9
100 g
300 g
3 oz - 85g
Vitamin C
Vit. C
Vitamin D
Vit. D
Vitamin A
Vit. A
Vitamin E
Vit. E
Vitamin B1
Vit. B1
Vitamin B2
Vit. B2
Vitamin B3
Vit. B3
Vitamin B5
Vit. B5
Vitamin B6
Vit. B6
Vitamin B12
Vit. B12
Vitamin K
Vit. K
Folate
Folate
23%
0%
16%
0%
12%
49%
37%
24%
150%
2268%
0%
8.3%
2
100 g
300 g
3 oz - 85g
Vitamin C
Vit. C
Vitamin D
Vit. D
Vitamin A
Vit. A
Vitamin E
Vit. E
Vitamin B1
Vit. B1
Vitamin B2
Vit. B2
Vitamin B3
Vit. B3
Vitamin B5
Vit. B5
Vitamin B6
Vit. B6
Vitamin B12
Vit. B12
Vitamin K
Vit. K
Folate
Folate
0%
0%
10%
100%
2.5%
28%
26%
0%
30%
63%
0.25%
4.5%
All nutrients comparison - raw data values
Nutrient
DV% diff.
Vitamin B12
18.14µg
0.5µg
735%
Copper
2.06mg
0.4mg
184%
Selenium
89.6µg
27.4µg
113%
Iron
10.06mg
3.5mg
82%
Protein
47.68g
16.1g
63%
Vitamin B6
0.65mg
0.13mg
40%
Manganese
0.89mg
39%
Vitamin E
5mg
33%
Cholesterol
130mg
50mg
27%
Zinc
3.26mg
1mg
21%
Magnesium
172mg
250mg
19%
Sodium
412mg
70mg
15%
Choline
65mg
12%
Calcium
113mg
10mg
10%
Calories
275kcal
90kcal
9%
Potassium
694mg
382mg
9%
Vitamin C
6.8mg
0mg
8%
Vitamin B5
0.4mg
8%
Vitamin B2
0.214mg
0.12mg
7%
Carbs
15.52g
2g
5%
Vitamin B3
1.995mg
1.4mg
4%
Vitamin B1
0.049mg
0.01mg
3%
Vitamin A
49µg
30µg
2%
Fats
0.8g
1.4g
1%
Phosphorus
282mg
272mg
1%
Folate
11µg
6µg
1%
Saturated fat
0.062g
0.361g
1%
Monounsaturated fat
0.056g
0.259g
1%
Polyunsaturated fat
0.046g
0.252g
1%
Protein per 100 calories
17g
18g
N/A
Calories per 10 g protein
58kcal
56kcal
N/A
Weight per 100 calories
36g
111g
N/A
Net carbs
15.52g
2g
N/A
Vitamin K
0.1µg
0%
Tryptophan
0.618mg
0%
Threonine
2.136mg
0%
Isoleucine
1.655mg
0%
Leucine
3.807mg
0%
Lysine
2.93mg
0%
Methionine
1.205mg
0%
Phenylalanine
1.648mg
0%
Valine
2.075mg
0%
Histidine
0.977mg
0%
Omega-3 - EPA
0.008g
0.119g
N/A
Omega-3 - DHA
0.012g
0g
N/A
Omega-3 - DPA
0.099g
N/A
Macronutrient Comparison
Macronutrient breakdown side-by-side comparison
3
48%
16%
32%
4%
Protein:
47.68 g
Fats:
0.8 g
Carbs:
15.52 g
Water:
32 g
Other:
4 g
2
16%
2%
79%
Protein:
16.1 g
Fats:
1.4 g
Carbs:
2 g
Water:
79.2 g
Other:
1.3 g
Contains
more
Protein Protein
+196.1%
Contains
more
Carbs Carbs
+676%
Contains
more
Other Other
+207.7%
Contains
more
Fats Fats
+75%
Contains
more
Water Water
+147.5%
Fat Type Comparison
Fat type breakdown side-by-side comparison
1
38%
34%
28%
Saturated fat:
Sat. Fat
0.062 g
Monounsaturated fat:
Mono. Fat
0.056 g
Polyunsaturated fat:
Poly. Fat
0.046 g
2
41%
30%
29%
Saturated fat:
Sat. Fat
0.361 g
Monounsaturated fat:
Mono. Fat
0.259 g
Polyunsaturated fat:
Poly. Fat
0.252 g
Contains
less
Sat. Fat Saturated fat
-82.8%
Contains
more
Mono. Fat Monounsaturated fat
+362.5%
Contains
more
Poly. Fat Polyunsaturated fat
+447.8%