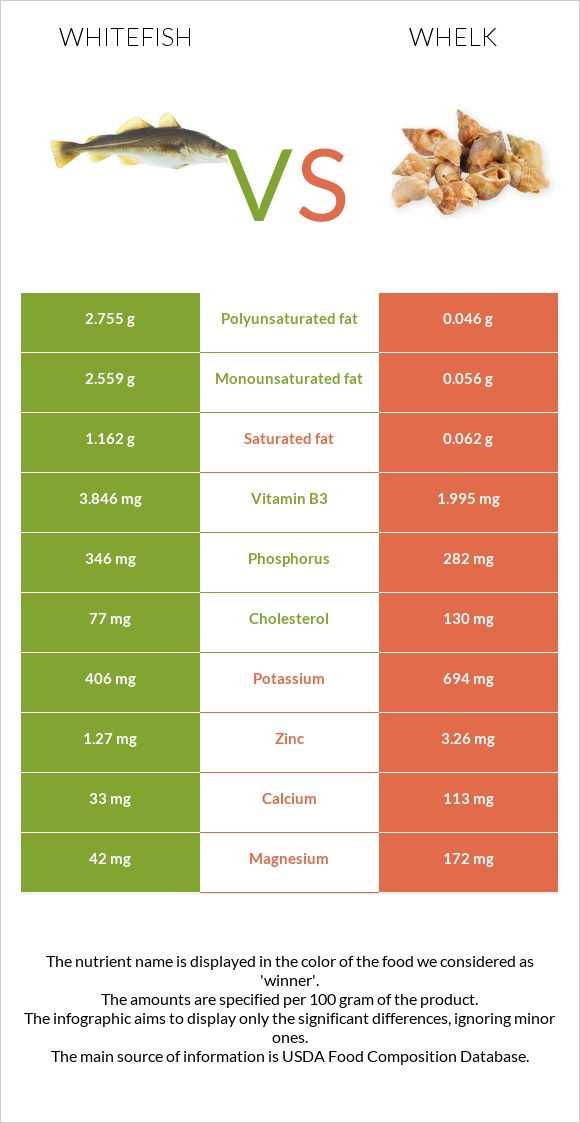
Differences between whitefish and whelk Whitefish contains less vitamin B12, copper, selenium, iron, manganese, magnesium, vitamin B6, and zinc than whelk. Whelk's daily need coverage for vitamin B12 is 716% higher. The food types used in this comparison are Fish, whitefish, mixed species, cooked, dry heat and Mollusks, whelk, unspecified, cooked, moist heat .
Infographic
Mineral Comparison
Mineral comparison score is based on the number of minerals by which one or the other food is richer. The "coverage" charts below show how much of the daily needs can be covered by 300 grams of the food.
2
100 g
300 g
3 oz - 85g 1 fillet - 154g
Magnesium
Magnesium
Calcium
Calcium
Potassium
Potassium
Iron
Iron
Copper
Copper
Zinc
Zinc
Phosphorus
Phosphorus
Sodium
Sodium
Manganese
Manganese
Selenium
Selenium
30%
9.9%
36%
18%
31%
35%
148%
8.5%
11%
88%
8
100 g
300 g
3 oz - 85g
Magnesium
Magnesium
Calcium
Calcium
Potassium
Potassium
Iron
Iron
Copper
Copper
Zinc
Zinc
Phosphorus
Phosphorus
Sodium
Sodium
Manganese
Manganese
Selenium
Selenium
123%
34%
61%
377%
687%
89%
121%
54%
116%
489%
Vitamin Comparison
Vitamin comparison score is based on the number of vitamins by which one or the other food is richer. The "coverage" charts below show how much of the daily needs can be covered by 300 grams of the food.
4
100 g
300 g
3 oz - 85g 1 fillet - 154g
Vitamin C
Vit. C
Vitamin D
Vit. D
Vitamin A
Vit. A
Vitamin E
Vit. E
Vitamin B1
Vit. B1
Vitamin B2
Vit. B2
Vitamin B3
Vit. B3
Vitamin B5
Vit. B5
Vitamin B6
Vit. B6
Vitamin B12
Vit. B12
Vitamin K
Vit. K
Folate
Folate
0%
0%
13%
0%
43%
36%
72%
52%
80%
120%
0%
13%
5
100 g
300 g
3 oz - 85g
Vitamin C
Vit. C
Vitamin D
Vit. D
Vitamin A
Vit. A
Vitamin E
Vit. E
Vitamin B1
Vit. B1
Vitamin B2
Vit. B2
Vitamin B3
Vit. B3
Vitamin B5
Vit. B5
Vitamin B6
Vit. B6
Vitamin B12
Vit. B12
Vitamin K
Vit. K
Folate
Folate
23%
0%
16%
0%
12%
49%
37%
24%
150%
2268%
0%
8.3%
All nutrients comparison - raw data values
Nutrient
DV% diff.
Vitamin B12
0.96µg
18.14µg
716%
Copper
0.092mg
2.06mg
219%
Selenium
16.2µg
89.6µg
133%
Iron
0.47mg
10.06mg
120%
Protein
24.47g
47.68g
46%
Manganese
0.086mg
0.89mg
35%
Magnesium
42mg
172mg
31%
Vitamin B6
0.346mg
0.65mg
23%
Cholesterol
77mg
130mg
18%
Zinc
1.27mg
3.26mg
18%
Polyunsaturated fat
2.755g
0.046g
18%
Sodium
65mg
412mg
15%
Vitamin B3
3.846mg
1.995mg
12%
Fats
7.51g
0.8g
10%
Vitamin B1
0.171mg
0.049mg
10%
Phosphorus
346mg
282mg
9%
Vitamin B5
0.865mg
0.4mg
9%
Vitamin C
0mg
6.8mg
8%
Calcium
33mg
113mg
8%
Potassium
406mg
694mg
8%
Monounsaturated fat
2.559g
0.056g
6%
Calories
172kcal
275kcal
5%
Carbs
0g
15.52g
5%
Vitamin B2
0.154mg
0.214mg
5%
Saturated fat
1.162g
0.062g
5%
Folate
17µg
11µg
2%
Vitamin A
39µg
49µg
1%
Protein per 100 calories
14g
17g
N/A
Calories per 10 g protein
70kcal
58kcal
N/A
Weight per 100 calories
58g
36g
N/A
Unsaturated / Saturated Fat ratio
4.6
1.6
N/A
Net carbs
0g
15.52g
N/A
Tryptophan
0.274mg
0.618mg
0%
Threonine
1.073mg
2.136mg
0%
Isoleucine
1.128mg
1.655mg
0%
Leucine
1.989mg
3.807mg
0%
Lysine
2.248mg
2.93mg
0%
Methionine
0.724mg
1.205mg
0%
Phenylalanine
0.955mg
1.648mg
0%
Valine
1.261mg
2.075mg
0%
Histidine
0.721mg
0.977mg
0%
Omega-3 - EPA
0.406g
0.008g
N/A
Omega-3 - DHA
1.206g
0.012g
N/A
Omega-3 - DPA
0.209g
N/A
Macronutrient Comparison
Macronutrient breakdown side-by-side comparison
2
24%
8%
65%
3%
Protein:
24.47 g
Fats:
7.51 g
Carbs:
0 g
Water:
65.09 g
Other:
2.93 g
3
48%
16%
32%
4%
Protein:
47.68 g
Fats:
0.8 g
Carbs:
15.52 g
Water:
32 g
Other:
4 g
Contains
more
Fats Fats
+838.8%
Contains
more
Water Water
+103.4%
Contains
more
Protein Protein
+94.9%
Contains
more
Carbs Carbs
+∞%
Contains
more
Other Other
+36.5%
Fat Type Comparison
Fat type breakdown side-by-side comparison
2
18%
40%
43%
Saturated fat:
Sat. Fat
1.162 g
Monounsaturated fat:
Mono. Fat
2.559 g
Polyunsaturated fat:
Poly. Fat
2.755 g
1
38%
34%
28%
Saturated fat:
Sat. Fat
0.062 g
Monounsaturated fat:
Mono. Fat
0.056 g
Polyunsaturated fat:
Poly. Fat
0.046 g
Contains
more
Mono. Fat Monounsaturated fat
+4469.6%
Contains
more
Poly. Fat Polyunsaturated fat
+5889.1%
Contains
less
Sat. Fat Saturated fat
-94.7%