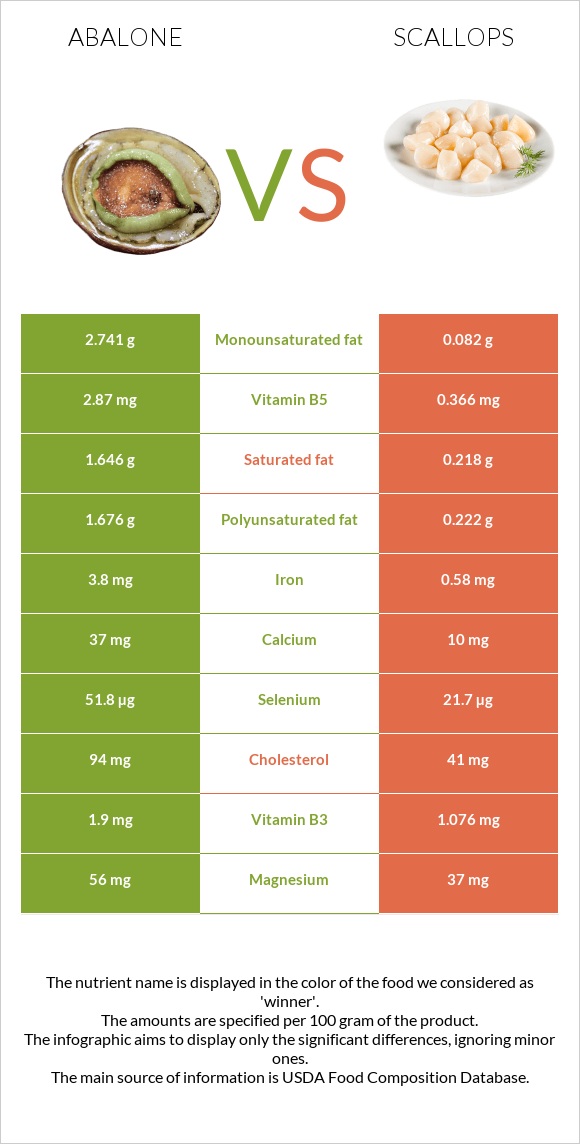
What are the main differences between abalone and scallops? Abalone is richer in selenium, vitamin B5, iron, copper, vitamin B1, and vitamin B2, yet scallops are richer in vitamin B12 and phosphorus. Scallops' daily need coverage for vitamin B12 is 61% higher. Abalone has 18 times more vitamin B1 than scallops. Abalone has 0.22mg of vitamin B1, while scallops have 0.012mg. Scallops contain less saturated fat. We used Mollusks, abalone, mixed species, cooked, fried and Mollusks, scallop, (bay and sea), cooked, steamed types in this comparison.
Infographic
Mineral Comparison
Mineral comparison score is based on the number of minerals by which one or the other food is richer. The "coverage" charts below show how much of the daily needs can be covered by 300 grams of the food.
7
100 g
300 g
3 oz - 85g
Magnesium
Magnesium
Calcium
Calcium
Potassium
Potassium
Iron
Iron
Copper
Copper
Zinc
Zinc
Phosphorus
Phosphorus
Sodium
Sodium
Manganese
Manganese
Selenium
Selenium
40%
11%
25%
143%
76%
26%
93%
77%
9.1%
283%
3
100 g
300 g
3 oz - 85g
Magnesium
Magnesium
Calcium
Calcium
Potassium
Potassium
Iron
Iron
Copper
Copper
Zinc
Zinc
Phosphorus
Phosphorus
Sodium
Sodium
Manganese
Manganese
Selenium
Selenium
26%
3%
28%
22%
11%
42%
183%
87%
3.8%
118%
Vitamin Comparison
Vitamin comparison score is based on the number of vitamins by which one or the other food is richer. The "coverage" charts below show how much of the daily needs can be covered by 300 grams of the food.
6
100 g
300 g
3 oz - 85g
Vitamin C
Vit. C
Vitamin D
Vit. D
Vitamin A
Vit. A
Vitamin E
Vit. E
Vitamin B1
Vit. B1
Vitamin B2
Vit. B2
Vitamin B3
Vit. B3
Vitamin B5
Vit. B5
Vitamin B6
Vit. B6
Vitamin B12
Vit. B12
Vitamin K
Vit. K
Folate
Folate
6%
0%
0.67%
0%
55%
30%
36%
172%
35%
86%
0%
11%
2
100 g
300 g
3 oz - 85g
Vitamin C
Vit. C
Vitamin D
Vit. D
Vitamin A
Vit. A
Vitamin E
Vit. E
Vitamin B1
Vit. B1
Vitamin B2
Vit. B2
Vitamin B3
Vit. B3
Vitamin B5
Vit. B5
Vitamin B6
Vit. B6
Vitamin B12
Vit. B12
Vitamin K
Vit. K
Folate
Folate
0%
0%
0.67%
0%
3%
5.5%
20%
22%
26%
269%
0%
15%
All nutrients comparison - raw data values
Nutrient
DV% diff.
Vitamin B12
0.69µg
2.15µg
61%
Selenium
51.8µg
21.7µg
55%
Vitamin B5
2.87mg
0.366mg
50%
Iron
3.8mg
0.58mg
40%
Phosphorus
217mg
426mg
30%
Copper
0.228mg
0.033mg
22%
Choline
110.7mg
20%
Cholesterol
94mg
41mg
18%
Vitamin B1
0.22mg
0.012mg
17%
Polyunsaturated fat
1.676g
0.222g
10%
Fats
6.78g
0.84g
9%
Vitamin B2
0.13mg
0.024mg
8%
Monounsaturated fat
2.741g
0.082g
7%
Saturated fat
1.646g
0.218g
6%
Magnesium
56mg
37mg
5%
Zinc
0.95mg
1.55mg
5%
Vitamin B3
1.9mg
1.076mg
5%
Calories
189kcal
111kcal
4%
Calcium
37mg
10mg
3%
Sodium
591mg
667mg
3%
Vitamin B6
0.15mg
0.112mg
3%
Protein
19.63g
20.54g
2%
Vitamin C
1.8mg
0mg
2%
Carbs
11.05g
5.41g
2%
Starch
3.69g
2%
Manganese
0.07mg
0.029mg
2%
Folate
14µg
20µg
2%
Potassium
284mg
314mg
1%
Protein per 100 calories
10g
19g
N/A
Calories per 10 g protein
96kcal
54kcal
N/A
Weight per 100 calories
53g
90g
N/A
Unsaturated / Saturated Fat ratio
2.7
1.4
N/A
Net carbs
11.05g
5.41g
N/A
Vitamin D*
2 IU
0%
Vitamin A
2µg
2µg
0%
Trans fat
0.009g
N/A
Tryptophan
0.224mg
0.173mg
0%
Threonine
0.838mg
0.629mg
0%
Isoleucine
0.854mg
0.692mg
0%
Leucine
1.386mg
1.226mg
0%
Lysine
1.433mg
1.258mg
0%
Methionine
0.441mg
0.487mg
0%
Phenylalanine
0.715mg
0.597mg
0%
Valine
0.86mg
0.645mg
0%
Histidine
0.378mg
0.314mg
0%
Omega-3 - EPA
0.054g
0.072g
N/A
Omega-3 - DHA
0.104g
N/A
Omega-3 - DPA
0.046g
0.005g
N/A
Omega-6 - Eicosadienoic acid
0.002g
N/A
Macronutrient Comparison
Macronutrient breakdown side-by-side comparison
2
20%
7%
11%
60%
2%
Protein:
19.63 g
Fats:
6.78 g
Carbs:
11.05 g
Water:
60.1 g
Other:
2.44 g
3
21%
5%
70%
3%
Protein:
20.54 g
Fats:
0.84 g
Carbs:
5.41 g
Water:
70.25 g
Other:
2.96 g
Contains
more
Fats Fats
+707.1%
Contains
more
Carbs Carbs
+104.3%
Contains
more
Water Water
+16.9%
Contains
more
Other Other
+21.3%
~equal in
Protein
~20.54g
Fat Type Comparison
Fat type breakdown side-by-side comparison
2
27%
45%
28%
Saturated fat:
Sat. Fat
1.646 g
Monounsaturated fat:
Mono. Fat
2.741 g
Polyunsaturated fat:
Poly. Fat
1.676 g
1
42%
16%
43%
Saturated fat:
Sat. Fat
0.218 g
Monounsaturated fat:
Mono. Fat
0.082 g
Polyunsaturated fat:
Poly. Fat
0.222 g
Contains
more
Mono. Fat Monounsaturated fat
+3242.7%
Contains
more
Poly. Fat Polyunsaturated fat
+655%
Contains
less
Sat. Fat Saturated fat
-86.8%