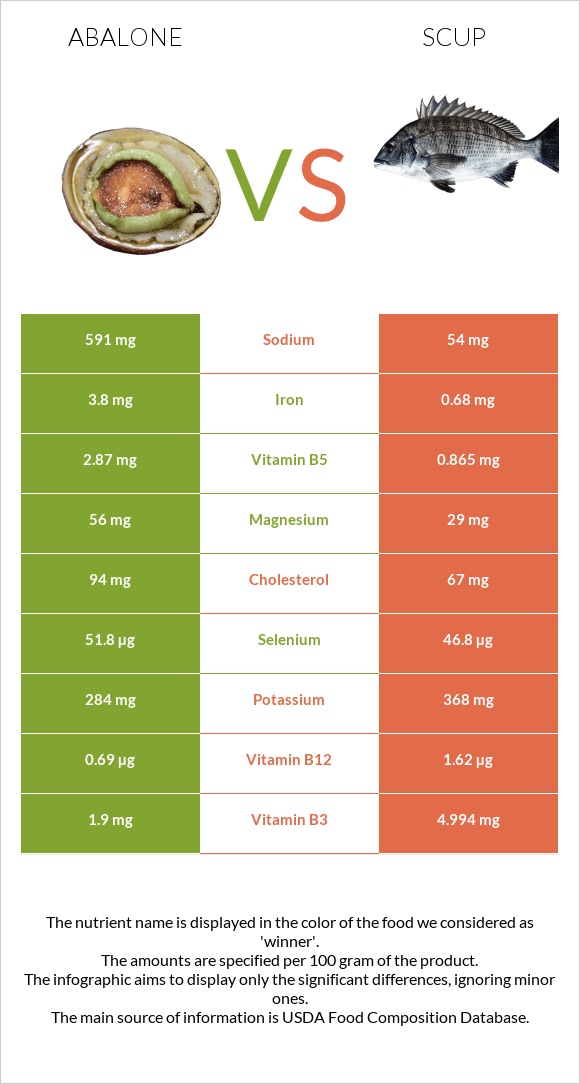
How are abalone and scup different? Abalone is higher in vitamin B5, iron, copper, selenium, and vitamin B1; however, scup is richer in vitamin B12, vitamin B3, and vitamin B6. Daily need coverage for vitamin B5 for abalone is 40% higher. Abalone contains 11 times more sodium than scup. While abalone contains 591mg of sodium, scup contains only 54mg. Mollusks, abalone, mixed species, cooked, fried and Fish, scup, cooked, dry heat are the varieties used in this article.
Infographic
Mineral Comparison
Mineral comparison score is based on the number of minerals by which one or the other food is richer. The "coverage" charts below show how much of the daily needs can be covered by 300 grams of the food.
5
100 g
300 g
3 oz - 85g
Magnesium
Magnesium
Calcium
Calcium
Potassium
Potassium
Iron
Iron
Copper
Copper
Zinc
Zinc
Phosphorus
Phosphorus
Sodium
Sodium
Manganese
Manganese
Selenium
Selenium
40%
11%
25%
143%
76%
26%
93%
77%
9.1%
283%
3
100 g
300 g
1 fillet - 50g 3 oz - 85g
Magnesium
Magnesium
Calcium
Calcium
Potassium
Potassium
Iron
Iron
Copper
Copper
Zinc
Zinc
Phosphorus
Phosphorus
Sodium
Sodium
Manganese
Manganese
Selenium
Selenium
21%
15%
32%
26%
22%
17%
102%
7%
5.9%
255%
Vitamin Comparison
Vitamin comparison score is based on the number of vitamins by which one or the other food is richer. The "coverage" charts below show how much of the daily needs can be covered by 300 grams of the food.
3
100 g
300 g
3 oz - 85g
Vitamin C
Vit. C
Vitamin D
Vit. D
Vitamin A
Vit. A
Vitamin E
Vit. E
Vitamin B1
Vit. B1
Vitamin B2
Vit. B2
Vitamin B3
Vit. B3
Vitamin B5
Vit. B5
Vitamin B6
Vit. B6
Vitamin B12
Vit. B12
Vitamin K
Vit. K
Folate
Folate
6%
0%
0.67%
0%
55%
30%
36%
172%
35%
86%
0%
11%
5
100 g
300 g
1 fillet - 50g 3 oz - 85g
Vitamin C
Vit. C
Vitamin D
Vit. D
Vitamin A
Vit. A
Vitamin E
Vit. E
Vitamin B1
Vit. B1
Vitamin B2
Vit. B2
Vitamin B3
Vit. B3
Vitamin B5
Vit. B5
Vitamin B6
Vit. B6
Vitamin B12
Vit. B12
Vitamin K
Vit. K
Folate
Folate
0%
0%
10%
0%
32%
28%
94%
52%
80%
203%
0%
13%
All nutrients comparison - raw data values
Nutrient
DV% diff.
Vitamin B5
2.87mg
0.865mg
40%
Iron
3.8mg
0.68mg
39%
Vitamin B12
0.69µg
1.62µg
39%
Sodium
591mg
54mg
23%
Vitamin B3
1.9mg
4.994mg
19%
Copper
0.228mg
0.065mg
18%
Vitamin B6
0.15mg
0.346mg
15%
Polyunsaturated fat
1.676g
11%
Protein
19.63g
24.21g
9%
Cholesterol
94mg
67mg
9%
Selenium
51.8µg
46.8µg
9%
Vitamin B1
0.22mg
0.127mg
8%
Saturated fat
1.646g
7%
Monounsaturated fat
2.741g
7%
Magnesium
56mg
29mg
6%
Fats
6.78g
3.5g
5%
Carbs
11.05g
0g
4%
Calories
189kcal
135kcal
3%
Zinc
0.95mg
0.62mg
3%
Phosphorus
217mg
237mg
3%
Vitamin A
2µg
31µg
3%
Vitamin C
1.8mg
0mg
2%
Potassium
284mg
368mg
2%
Calcium
37mg
51mg
1%
Manganese
0.07mg
0.045mg
1%
Vitamin B2
0.13mg
0.122mg
1%
Folate
14µg
17µg
1%
Protein per 100 calories
10g
18g
N/A
Calories per 10 g protein
96kcal
56kcal
N/A
Weight per 100 calories
53g
74g
N/A
Unsaturated / Saturated Fat ratio
2.7
N/A
Net carbs
11.05g
0g
N/A
Tryptophan
0.224mg
0.271mg
0%
Threonine
0.838mg
1.061mg
0%
Isoleucine
0.854mg
1.115mg
0%
Leucine
1.386mg
1.967mg
0%
Lysine
1.433mg
2.223mg
0%
Methionine
0.441mg
0.716mg
0%
Phenylalanine
0.715mg
0.945mg
0%
Valine
0.86mg
1.247mg
0%
Histidine
0.378mg
0.713mg
0%
Omega-3 - EPA
0.054g
N/A
Omega-3 - DPA
0.046g
N/A
Macronutrient Comparison
Macronutrient breakdown side-by-side comparison
2
20%
7%
11%
60%
2%
Protein:
19.63 g
Fats:
6.78 g
Carbs:
11.05 g
Water:
60.1 g
Other:
2.44 g
3
24%
4%
68%
4%
Protein:
24.21 g
Fats:
3.5 g
Carbs:
0 g
Water:
68.42 g
Other:
3.87 g
Contains
more
Fats Fats
+93.7%
Contains
more
Carbs Carbs
+∞%
Contains
more
Protein Protein
+23.3%
Contains
more
Water Water
+13.8%
Contains
more
Other Other
+58.6%