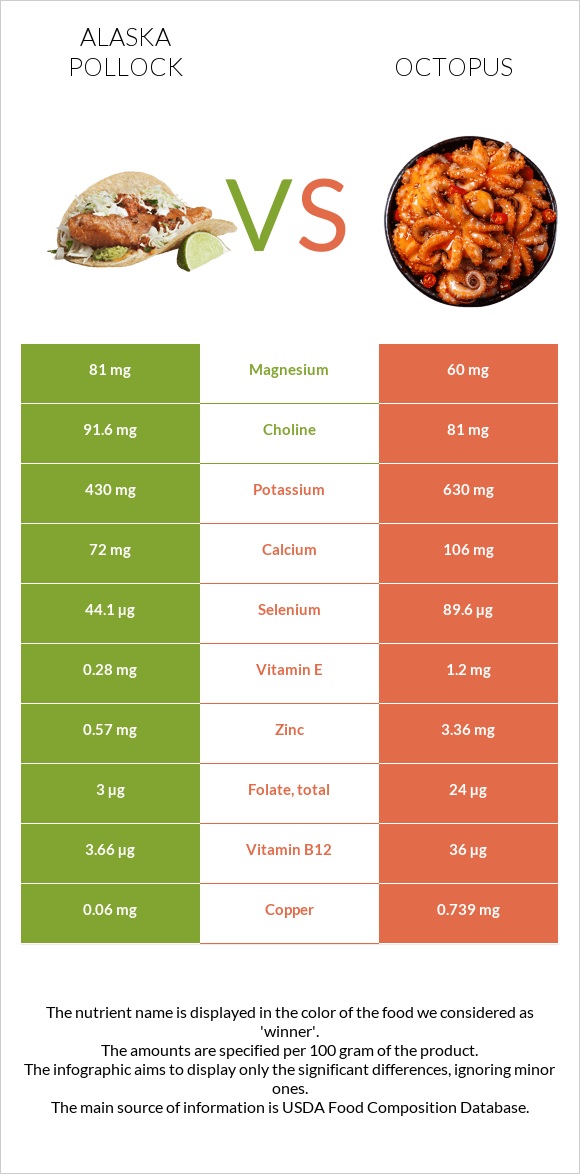
What are the differences between pollock and octopus? Pollock is higher in vitamin B2 and vitamin D*, yet octopus is higher in vitamin B12, iron, selenium, copper, zinc, vitamin B6, vitamin B5, and vitamin C. Octopus's daily need coverage for vitamin B12 is 1348% more. We used Fish, pollock, Alaska, cooked, dry heat (may have been previously frozen) and Mollusks, octopus, common, cooked, moist heat types in this article.
Infographic
Mineral Comparison
Mineral comparison score is based on the number of minerals by which one or the other food is richer. The "coverage" charts below show how much of the daily needs can be covered by 300 grams of the food.
1
100 g
300 g
1 fillet - 60g 3 oz - 85g
Magnesium
Magnesium
Calcium
Calcium
Potassium
Potassium
Iron
Iron
Copper
Copper
Zinc
Zinc
Phosphorus
Phosphorus
Sodium
Sodium
Manganese
Manganese
Selenium
Selenium
58%
22%
38%
21%
20%
16%
114%
55%
2.3%
241%
7
100 g
300 g
3 oz - 85g
Magnesium
Magnesium
Calcium
Calcium
Potassium
Potassium
Iron
Iron
Copper
Copper
Zinc
Zinc
Phosphorus
Phosphorus
Sodium
Sodium
Manganese
Manganese
Selenium
Selenium
43%
32%
56%
358%
246%
92%
120%
60%
6.1%
489%
Vitamin Comparison
Vitamin comparison score is based on the number of vitamins by which one or the other food is richer. The "coverage" charts below show how much of the daily needs can be covered by 300 grams of the food.
2
100 g
300 g
1 fillet - 60g 3 oz - 85g
Vitamin C
Vit. C
Vitamin D
Vit. D
Vitamin A
Vit. A
Vitamin E
Vit. E
Vitamin B1
Vit. B1
Vitamin B2
Vit. B2
Vitamin B3
Vit. B3
Vitamin B5
Vit. B5
Vitamin B6
Vit. B6
Vitamin B12
Vit. B12
Vitamin K
Vit. K
Folate
Folate
0%
20%
5.7%
5.6%
14%
51%
74%
26%
76%
458%
0.25%
2.3%
7
100 g
300 g
3 oz - 85g
Vitamin C
Vit. C
Vitamin D
Vit. D
Vitamin A
Vit. A
Vitamin E
Vit. E
Vitamin B1
Vit. B1
Vitamin B2
Vit. B2
Vitamin B3
Vit. B3
Vitamin B5
Vit. B5
Vitamin B6
Vit. B6
Vitamin B12
Vit. B12
Vitamin K
Vit. K
Folate
Folate
27%
0%
30%
24%
14%
18%
71%
54%
150%
4500%
0.25%
18%
All nutrients comparison - raw data values
Nutrient
DV% diff.
Vitamin B12
3.66µg
36µg
1348%
Iron
0.56mg
9.54mg
112%
Selenium
44.1µg
89.6µg
83%
Copper
0.06mg
0.739mg
75%
Zinc
0.57mg
3.36mg
25%
Vitamin B6
0.329mg
0.648mg
25%
Protein
23.48g
29.82g
13%
Vitamin B2
0.223mg
0.076mg
11%
Vitamin C
0mg
8mg
9%
Vitamin B5
0.432mg
0.9mg
9%
Vitamin A
17µg
90µg
8%
Vitamin D
1.3µg
0µg
7%
Vitamin D*
51 IU
0 IU
6%
Potassium
430mg
630mg
6%
Vitamin E
0.28mg
1.2mg
6%
Magnesium
81mg
60mg
5%
Folate
3µg
24µg
5%
Calories
111kcal
164kcal
3%
Cholesterol
86mg
96mg
3%
Calcium
72mg
106mg
3%
Phosphorus
267mg
279mg
2%
Sodium
419mg
460mg
2%
Choline
91.6mg
81mg
2%
Fats
1.18g
2.08g
1%
Carbs
0g
4.4g
1%
Manganese
0.018mg
0.047mg
1%
Vitamin B3
3.949mg
3.78mg
1%
Saturated fat
0.159g
0.453g
1%
Polyunsaturated fat
0.583g
0.477g
1%
Protein per 100 calories
21g
18g
N/A
Calories per 10 g protein
47kcal
55kcal
N/A
Weight per 100 calories
90g
61g
N/A
Unsaturated / Saturated Fat ratio
4.5
1.8
N/A
Net carbs
0g
4.4g
N/A
Vitamin B1
0.054mg
0.057mg
0%
Vitamin K
0.1µg
0.1µg
0%
Monounsaturated fat
0.134g
0.324g
0%
Tryptophan
0.263mg
0.334mg
0%
Threonine
1.029mg
1.283mg
0%
Isoleucine
1.082mg
1.298mg
0%
Leucine
1.908mg
2.099mg
0%
Lysine
2.157mg
2.228mg
0%
Methionine
0.696mg
0.673mg
0%
Phenylalanine
0.917mg
1.069mg
0%
Valine
1.21mg
1.303mg
0%
Histidine
0.691mg
0.573mg
0%
Omega-3 - EPA
0.086g
0.152g
N/A
Omega-3 - DHA
0.423g
0.162g
N/A
Omega-3 - DPA
0.027g
0.012g
N/A
Macronutrient Comparison
Macronutrient breakdown side-by-side comparison
1
23%
74%
2%
Protein:
23.48 g
Fats:
1.18 g
Carbs:
0 g
Water:
73.65 g
Other:
1.69 g
4
30%
2%
4%
61%
3%
Protein:
29.82 g
Fats:
2.08 g
Carbs:
4.4 g
Water:
60.5 g
Other:
3.2 g
Contains
more
Water Water
+21.7%
Contains
more
Protein Protein
+27%
Contains
more
Fats Fats
+76.3%
Contains
more
Carbs Carbs
+∞%
Contains
more
Other Other
+89.3%
Fat Type Comparison
Fat type breakdown side-by-side comparison
2
18%
15%
67%
Saturated fat:
Sat. Fat
0.159 g
Monounsaturated fat:
Mono. Fat
0.134 g
Polyunsaturated fat:
Poly. Fat
0.583 g
1
36%
26%
38%
Saturated fat:
Sat. Fat
0.453 g
Monounsaturated fat:
Mono. Fat
0.324 g
Polyunsaturated fat:
Poly. Fat
0.477 g
Contains
less
Sat. Fat Saturated fat
-64.9%
Contains
more
Poly. Fat Polyunsaturated fat
+22.2%
Contains
more
Mono. Fat Monounsaturated fat
+141.8%