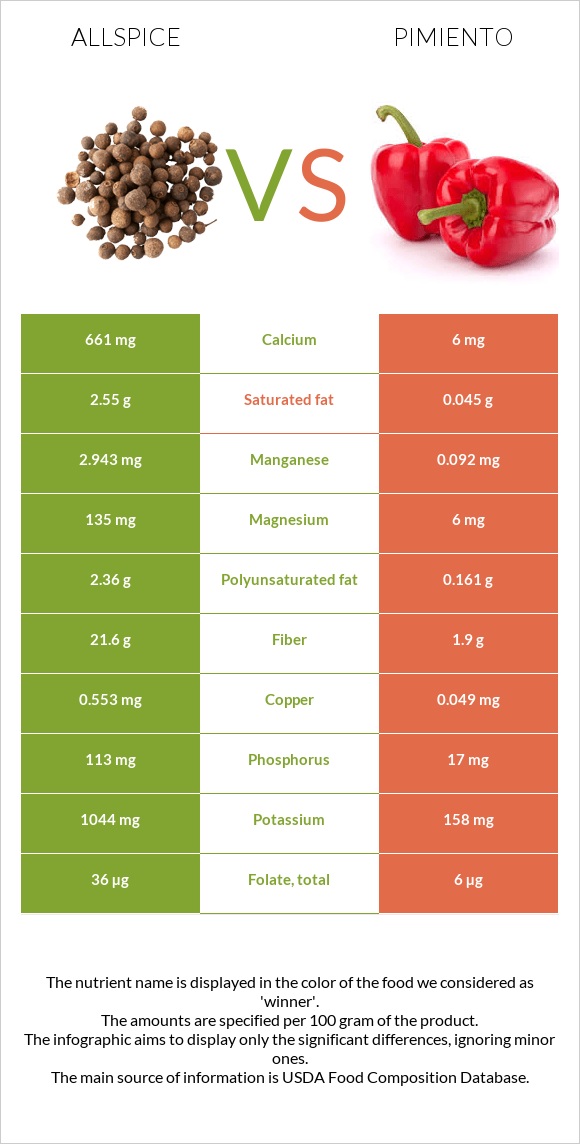
The main differences between allspice and pimiento Allspice has more manganese, fiber, iron, calcium, copper, magnesium, potassium, and vitamin B3; however, pimiento has more vitamin C and vitamin A. Daily need coverage for manganese for allspice is 124% higher. Pimiento has 110 times less calcium than allspice. Allspice has 661mg of calcium, while pimiento has 6mg. Pimiento has a higher glycemic index than allspice. Food types used in this article are Spices, allspice, ground and Pimento, canned .
Infographic
Mineral Comparison
Mineral comparison score is based on the number of minerals by which one or the other food is richer. The "coverage" charts below show how much of the daily needs can be covered by 300 grams of the food.
9
100 g
300 g
0.25 tsp - 0.5g 1 tsp - 1.9g 1 tbsp - 6g
Magnesium
Magnesium
Calcium
Calcium
Potassium
Potassium
Iron
Iron
Copper
Copper
Zinc
Zinc
Phosphorus
Phosphorus
Sodium
Sodium
Manganese
Manganese
Selenium
Selenium
96%
198%
92%
265%
184%
28%
48%
10%
384%
15%
1
100 g
300 g
1 slice - 1g 1 tbsp - 12g 1 pimiento, whole - 66g 1 cup - 192g
Magnesium
Magnesium
Calcium
Calcium
Potassium
Potassium
Iron
Iron
Copper
Copper
Zinc
Zinc
Phosphorus
Phosphorus
Sodium
Sodium
Manganese
Manganese
Selenium
Selenium
4.3%
1.8%
14%
63%
16%
5.2%
7.3%
1.8%
12%
1.1%
Vitamin Comparison
Vitamin comparison score is based on the number of vitamins by which one or the other food is richer. The "coverage" charts below show how much of the daily needs can be covered by 300 grams of the food.
3
100 g
300 g
0.25 tsp - 0.5g 1 tsp - 1.9g 1 tbsp - 6g
Vitamin C
Vit. C
Vitamin D
Vit. D
Vitamin A
Vit. A
Vitamin E
Vit. E
Vitamin B1
Vit. B1
Vitamin B2
Vit. B2
Vitamin B3
Vit. B3
Vitamin B5
Vit. B5
Vitamin B6
Vit. B6
Vitamin B12
Vit. B12
Vitamin K
Vit. K
Folate
Folate
131%
0%
9%
0%
25%
15%
54%
0%
48%
0%
0%
27%
5
100 g
300 g
1 slice - 1g 1 tbsp - 12g 1 pimiento, whole - 66g 1 cup - 192g
Vitamin C
Vit. C
Vitamin D
Vit. D
Vitamin A
Vit. A
Vitamin E
Vit. E
Vitamin B1
Vit. B1
Vitamin B2
Vit. B2
Vitamin B3
Vit. B3
Vitamin B5
Vit. B5
Vitamin B6
Vit. B6
Vitamin B12
Vit. B12
Vitamin K
Vit. K
Folate
Folate
283%
0%
44%
14%
4.3%
14%
12%
0.6%
50%
0%
21%
4.5%
All nutrients comparison - raw data values
Nutrient
DV% diff.
Manganese
2.943mg
0.092mg
124%
Fiber
21.6g
1.9g
79%
Iron
7.06mg
1.68mg
67%
Calcium
661mg
6mg
66%
Copper
0.553mg
0.049mg
56%
Vitamin C
39.2mg
84.9mg
51%
Magnesium
135mg
6mg
31%
Potassium
1044mg
158mg
26%
Carbs
72.12g
5.1g
22%
Polyunsaturated fat
2.36g
0.161g
15%
Phosphorus
113mg
17mg
14%
Vitamin B3
2.86mg
0.615mg
14%
Fats
8.69g
0.3g
13%
Calories
263kcal
23kcal
12%
Vitamin A
27µg
133µg
12%
Saturated fat
2.55g
0.045g
11%
Protein
6.09g
1.1g
10%
Folate
36µg
6µg
8%
Zinc
1.01mg
0.19mg
7%
Vitamin B1
0.101mg
0.017mg
7%
Vitamin K
8.3µg
7%
Vitamin E
0.69mg
5%
Selenium
2.7µg
0.2µg
5%
Sodium
77mg
14mg
3%
Monounsaturated fat
0.66g
0.02g
2%
Choline
6.3mg
1%
Protein per 100 calories
2.3g
4.8g
N/A
Calories per 10 g protein
432kcal
209kcal
N/A
Weight per 100 calories
38g
435g
N/A
Unsaturated / Saturated Fat ratio
1.2
4
N/A
Net carbs
50.52g
3.2g
N/A
Sugar
2.71g
N/A
Vitamin B2
0.063mg
0.06mg
0%
Vitamin B5
0.01mg
0%
Vitamin B6
0.21mg
0.215mg
0%
Tryptophan
0.014mg
0%
Threonine
0.04mg
0%
Isoleucine
0.036mg
0%
Leucine
0.058mg
0%
Lysine
0.049mg
0%
Methionine
0.013mg
0%
Phenylalanine
0.034mg
0%
Valine
0.046mg
0%
Histidine
0.022mg
0%
Macronutrient Comparison
Macronutrient breakdown side-by-side comparison
4
6%
9%
72%
8%
5%
Protein:
6.09 g
Fats:
8.69 g
Carbs:
72.12 g
Water:
8.46 g
Other:
4.64 g
1
5%
93%
Protein:
1.1 g
Fats:
0.3 g
Carbs:
5.1 g
Water:
93.1 g
Other:
0.4 g
Contains
more
Protein Protein
+453.6%
Contains
more
Fats Fats
+2796.7%
Contains
more
Carbs Carbs
+1314.1%
Contains
more
Other Other
+1060%
Contains
more
Water Water
+1000.5%
Fat Type Comparison
Fat type breakdown side-by-side comparison
2
46%
12%
42%
Saturated fat:
Sat. Fat
2.55 g
Monounsaturated fat:
Mono. Fat
0.66 g
Polyunsaturated fat:
Poly. Fat
2.36 g
1
20%
9%
71%
Saturated fat:
Sat. Fat
0.045 g
Monounsaturated fat:
Mono. Fat
0.02 g
Polyunsaturated fat:
Poly. Fat
0.161 g
Contains
more
Mono. Fat Monounsaturated fat
+3200%
Contains
more
Poly. Fat Polyunsaturated fat
+1365.8%
Contains
less
Sat. Fat Saturated fat
-98.2%