Apple juice vs. Orange juice — Health Impact and Nutrition Comparison


Summary
Apple and orange juices contain 11.1g and 10.2g of net carbs, respectively, with less than 1g of proteins, fats, and fiber. Apple juice also has a slightly higher glycemic index value.
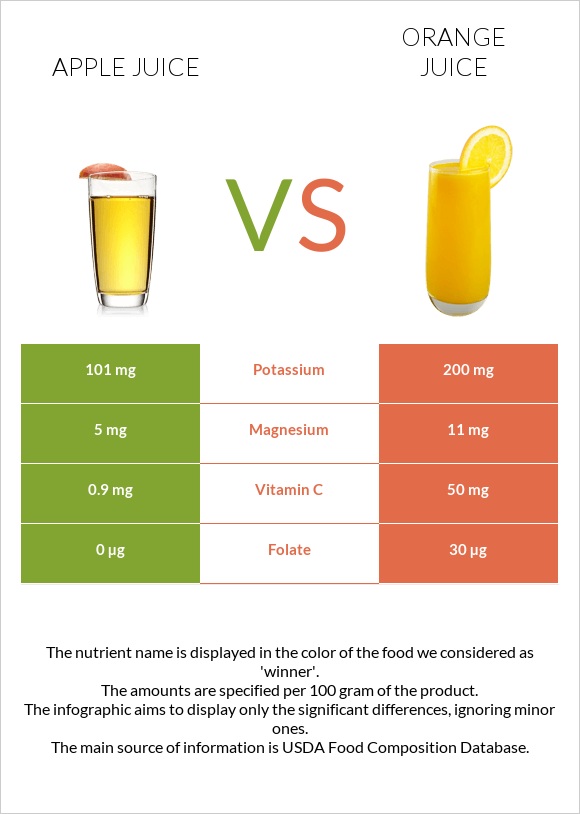
Apple juice is naturally very low in vitamins and minerals, whereas orange juice is high in vitamins C, B1, folate, potassium, and copper.
On the one hand, the phytochemicals in juices show various beneficial effects on health; on the other hand, carbs and unpasteurized juices may lead to adverse health outcomes.
Introduction
Apple and orange juices are one of the most consumed juices worldwide. This article aims to compare the nutritional values of juices and see if there’s an actual health impact difference between the two. This article also mentions consumption recommendations and the importance of juice pasteurization.
Consumption Recommendations
The 2020-2025 Dietary Guidelines for Americans recommendations:
- At least 50% of the recommended amount of fruits should come from whole fruits, not fruit juices,
- The juices should always be pasteurized,
- The juices should be 100% juice or 100% juice diluted with water and no sugars added (1).
American Academy of Pediatrics recommendations:
- Infants should not consume fruit juices
- Toddlers should not consume more than 4 ounces daily
- 4-6-year-old children should not consume more than 4-6 ounces daily
- 7-18-year-old children should not consume more than 8 ounces daily (2).
Nutrition
The nutritional values for 100g of apple juice (without added vitamin C and minerals) and raw (fresh-squeezed) orange juice are presented.
It is important to note that different brands enrich the juices with nutrients (e.g., calcium, potassium, B complex vitamins, and sugar).
Macronutrients and Calories
The juices contain 88% water and 12% nutrients, mainly carbs. Apple and orange juices contain 11.1g and 10.2g of net carbs, respectively, with less than 1g of proteins, fats, and fiber.
100g of either juice provides 45-46 calories, whereas one cup (~248g) provides 112-114.
Macronutrient Comparison
Contains
more
ProteinProtein
+600%
Contains
more
FatsFats
+53.8%
Contains
more
OtherOther
+73.9%
Carbohydrates
Apple juice is slightly higher in net carbs than orange juice, with less than one gram difference. Fructose is the predominant carb in apple juice, whereas sucrose is predominant in orange juice.
100g of apple juice and orange juice contains 11.1g and 10.2g of total carbs, and one cup contains 27.5g and 25.3g, respectively.
100g of either juice contains 0.2g of dietary fiber, whereas one cup contains 0.5g.
Apple juice contains the following carb types in descending order: fructose (over 50%), glucose, and sucrose.
Orange juice contains the following carb types in descending order: sucrose (45%), fructose, and glucose (3).
Vitamins
Apple is very low or absent in all vitamins, whereas orange juice is very high in vitamin C and contains a decent amount of vitamins B1 and folate.
While unenriched apple juice contains only 0.9mg of vitamin C, the enriched one contains 38.5mg (4).
Raw orange juice contains 50mg of vitamin C, whereas canned one contains 30mg. Raw orange juice is usually richer in vitamins than bottled ones (3).
The recommended daily vitamin C intake is 75mg for women and 90mg for men (1).
Vitamin Comparison
Contains
more
Vitamin CVitamin C
+5455.6%
Contains
more
Vitamin AVitamin A
+∞%
Contains
more
Vitamin EVitamin E
+300%
Contains
more
Vitamin B1Vitamin B1
+328.6%
Contains
more
Vitamin B2Vitamin B2
+76.5%
Contains
more
Vitamin B3Vitamin B3
+447.9%
Contains
more
Vitamin B5Vitamin B5
+287.8%
Contains
more
Vitamin B6Vitamin B6
+122.2%
Contains
more
Vitamin KVitamin K
+∞%
Contains
more
FolateFolate
+∞%
Minerals
The juices are not mineral-dense; however, raw orange juice is comparably richer in all minerals than apple juice.
Orange juice is two times richer in potassium and 3.5 times richer in copper.
Mineral Comparison
Contains
more
ManganeseManganese
+428.6%
Contains
more
MagnesiumMagnesium
+120%
Contains
more
CalciumCalcium
+37.5%
Contains
more
PotassiumPotassium
+98%
Contains
more
IronIron
+66.7%
Contains
more
CopperCopper
+266.7%
Contains
more
ZincZinc
+150%
Contains
more
PhosphorusPhosphorus
+142.9%
Contains
less
SodiumSodium
-75%
Glycemic Index & Glycemic Load
The glycemic index of orange juice is 50, whereas the glycemic index of apple juice is 46.
Both juices are considered to have low glycemic index values.
The glycemic load of orange juice is 13, considered medium.
Related articles:
Insulin Index
The insulin index of orange juice is 55, whereas the insulin index of apple juice is 64.
Related article: Glycemic Index vs. Insulin Index
Acidity
The pH value of apple juice ranges from 3.35 - 4.00, whereas the pH value of canned apple juice ranges from 3.3 - 3.5.
The pH value of orange juice ranges from 3.30 - 4.19, whereas canned orange juice’s pH value is 3.0 - 4.0 (5, 6).
The PRAL values of apple and orange juices are -2 and -3.7, respectively. The negative values mean that the juices are alkaline or base-producing.
Weight Loss & Diets
According to several studies, 100% fruit and sugar-sweetened juices do not significantly affect satiety, as they are low in fiber and proteins and may result in overeating and weight gain.
100% fruit juices are not associated with an increased risk of metabolic syndrome, while sugar-sweetened juices are linked to an increased risk (7, 8, 9, 10).
In a balanced diet, children may consume orange and apple juices as a part of a healthy diet; on the other hand, overconsumption of fruit juices may lead to malnutrition: overnutrition or undernutrition (2, 10).
Apple and orange juices are included in a gastroparesis liquid diet and juice fasting diet.
Health Impact
Health Benefits
Effects Of Juice Phytochemicals
Vitamin C, folate, carotenoids, and polyphenols in orange juice contribute to its antioxidant and anti-inflammatory properties. Long-term orange juice consumption may reduce inflammation and inflammatory markers, decrease cancer risk, show cardioprotective and neuroprotective effects, and improve cognitive performance (11, 12, 13, 14, 15, 16).
Apple juice also contains various phytochemicals with antioxidant, anti-inflammatory and antiproliferative effects. Apple juice consumption may reduce inflammation and decrease the risk of heart disease and cancer (lung and colon cancers). Long-term apple juice consumption may also beneficially affect Alzheimer’s disease, cognitive decline, diabetes, and the gut from drug injury (17, 18, 19, 20, 21).
Further research is required since most studies are conducted on animals.
Kidney Stones
According to several studies, orange juice consumption may lower kidney stone formation risks and beneficially affect calcareous and uric acid stones (22, 23, 24).
The results regarding apple juice and kidney stones are contradictory, as several studies find no associations, whereas others suggest apple juice may increase the risk of kidney stone formation (24, 25, 26).
Downsides and Risks
Tooth Decay
High sugar content in fruit juices, especially sugar-sweetened juices, increases the risk of dental caries and enamel erosion. The bacterial digestion of sugars produces acids that demineralize enamel and dentine, the hard tissues of teeth (27, 28).
Type 2 Diabetes
A meta-analysis concludes that 100% fruit juice intake is not associated with an increased risk of developing type 2 diabetes, whereas sugar-sweetened juice is linked to an increased risk (29, 30).
Unpasteurized Juice Risks
Raw or fresh-squeezed juices are not pasteurized or heat-treated and may cause foodborne illness, otherwise called “food poisoning.” Common symptoms are vomiting, diarrhea, fever, abdominal cramps, headache, and muscle and joint pain (31).
Children, older adults, pregnant women, and people with weakened immune systems have an increased risk of adverse outcomes and death and should avoid unpasteurized juices entirely (32).
Sources.
- Dietary Guidelines for Americans, 2020-2025
- https://publications.aap.org/pediatrics/article/139/6/e20170967/38754/
- https://fdc.nal.usda.gov/fdc-app.html#/food-details/169099/nutrients
- https://fdc.nal.usda.gov/fdc-app.html#/food-details/167771/nutrients
- pH Values of Common Foods and Ingredients
- BAM Chapter 21A: Examination of Canned Foods | FDA
- https://pubmed.ncbi.nlm.nih.gov/34534895/
- https://www.ncbi.nlm.nih.gov/pmc/articles/PMC2664987/
- https://pubmed.ncbi.nlm.nih.gov/15808893/
- https://pubmed.ncbi.nlm.nih.gov/28562300/
- https://pubmed.ncbi.nlm.nih.gov/34249019/
- https://www.ncbi.nlm.nih.gov/pmc/articles/PMC8288538/
- https://www.ncbi.nlm.nih.gov/pmc/articles/PMC7284956/
- https://www.ncbi.nlm.nih.gov/pmc/articles/PMC7933480/
- https://www.ncbi.nlm.nih.gov/pmc/articles/PMC2533031/
- https://pubmed.ncbi.nlm.nih.gov/23919376/
- https://pubmed.ncbi.nlm.nih.gov/33673327/
- https://www.ncbi.nlm.nih.gov/pmc/articles/PMC3183591/
- https://pubmed.ncbi.nlm.nih.gov/16914839/
- https://pubmed.ncbi.nlm.nih.gov/18855307/
- https://pubmed.ncbi.nlm.nih.gov/35215471/
- https://pubmed.ncbi.nlm.nih.gov/34836376/
- https://pubmed.ncbi.nlm.nih.gov/8501777/
- https://pubmed.ncbi.nlm.nih.gov/32123972/
- https://pubmed.ncbi.nlm.nih.gov/9508013/
- https://pubmed.ncbi.nlm.nih.gov/8561157/
- https://pubmed.ncbi.nlm.nih.gov/28562300/
- https://www.who.int/news-room/fact-sheets/detail/sugars-and-dental-caries
- https://pubmed.ncbi.nlm.nih.gov/23990623/
- https://www.ncbi.nlm.nih.gov/pmc/articles/PMC3969361/
- https://pubmed.ncbi.nlm.nih.gov/26371569/
- What You Need to Know About Juice Safety | FDA

Infographic
All nutrients comparison - raw data values
| Nutrient | |
|
DV% diff. |
| Vitamin C | 0.9mg | 50mg | 55% |
| Folate | 0µg | 30µg | 8% |
| Fructose | 5.73g | 7% | |
| Vitamin B1 | 0.021mg | 0.09mg | 6% |
| Copper | 0.012mg | 0.044mg | 4% |
| Potassium | 101mg | 200mg | 3% |
| Manganese | 0.074mg | 0.014mg | 3% |
| Vitamin B5 | 0.049mg | 0.19mg | 3% |
| Vitamin B3 | 0.073mg | 0.4mg | 2% |
| Vitamin B6 | 0.018mg | 0.04mg | 2% |
| Protein | 0.1g | 0.7g | 1% |
| Magnesium | 5mg | 11mg | 1% |
| Iron | 0.12mg | 0.2mg | 1% |
| Phosphorus | 7mg | 17mg | 1% |
| Vitamin A | 0µg | 10µg | 1% |
| Vitamin B2 | 0.017mg | 0.03mg | 1% |
| Choline | 1.8mg | 6.2mg | 1% |
| Calories | 46kcal | 45kcal | 0% |
| Protein per 100 calories | 0.22g | 1.6g | N/A |
| Calories per 10 g protein | 4600kcal | 643kcal | N/A |
| Weight per 100 calories | 217g | 222g | N/A |
| Fats | 0.13g | 0.2g | 0% |
| Net carbs | 11.1g | 10.2g | N/A |
| Carbs | 11.3g | 10.4g | 0% |
| Calcium | 8mg | 11mg | 0% |
| Sugar | 9.62g | 8.4g | N/A |
| Fiber | 0.2g | 0.2g | 0% |
| Zinc | 0.02mg | 0.05mg | 0% |
| Sodium | 4mg | 1mg | 0% |
| Vitamin E | 0.01mg | 0.04mg | 0% |
| Selenium | 0.1µg | 0.1µg | 0% |
| Vitamin K | 0µg | 0.1µg | 0% |
| Saturated fat | 0.022g | 0.024g | 0% |
| Monounsaturated fat | 0.006g | 0.036g | 0% |
| Polyunsaturated fat | 0.039g | 0.04g | 0% |
| Tryptophan | 0.002mg | 0% | |
| Threonine | 0.008mg | 0% | |
| Isoleucine | 0.008mg | 0% | |
| Leucine | 0.013mg | 0% | |
| Lysine | 0.009mg | 0% | |
| Methionine | 0.003mg | 0% | |
| Phenylalanine | 0.009mg | 0% | |
| Valine | 0.011mg | 0% | |
| Histidine | 0.003mg | 0% |
Fat Type Comparison
| Contains more Mono. FatMonounsaturated fat | +500% |
People also compare


References
All the values for which the sources are not specified explicitly are taken from FDA’s Food Central. The exact link to the food presented on this page can be found below.
- Apple juice - https://fdc.nal.usda.gov/fdc-app.html#/food-details/173933/nutrients
- Orange juice - https://fdc.nal.usda.gov/fdc-app.html#/food-details/169098/nutrients
All the Daily Values are presented for males aged 31-50, for 2000-calorie diets.