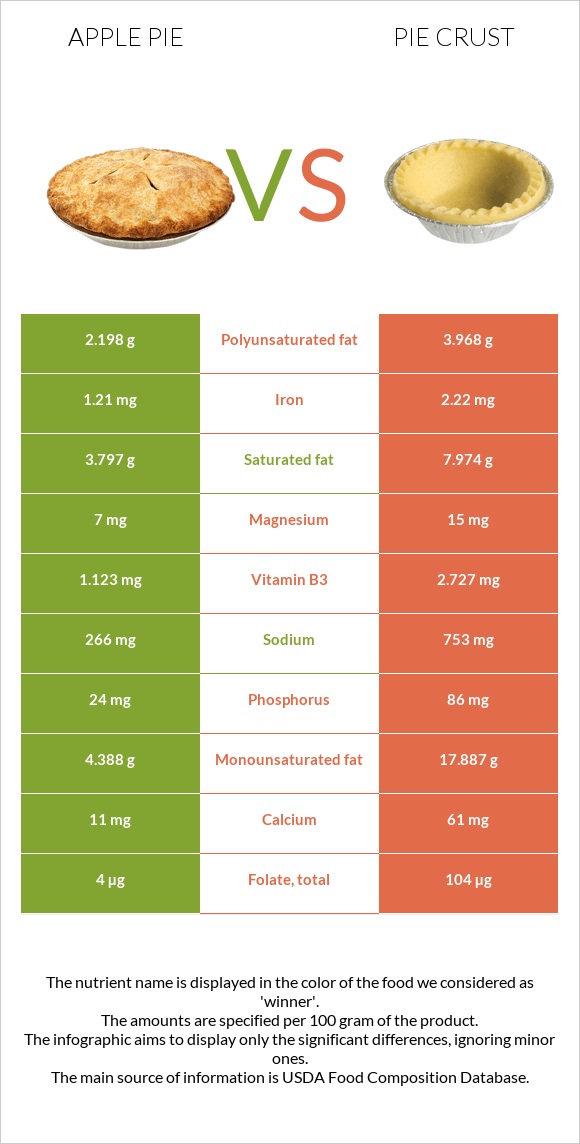
A recap on the differences between apple pie and pie crust Apple pie has less folate, vitamin B1, iron, vitamin B3, phosphorus, and manganese. Pie crust covers your daily folate needs 25% more than apple pie. Apple pie has less saturated fat. Food varieties used in this article are Pie, apple, commercially prepared, unenriched flour and Pie crust, standard-type, dry mix .
Infographic
Mineral Comparison
Mineral comparison score is based on the number of minerals by which one or the other food is richer. The "coverage" charts below show how much of the daily needs can be covered by 300 grams of the food.
1
100 g
300 g
1 oz - 28.35g 1 piece (1/6 of 8" pie) - 117g 1 piece (1/8 of 9" dia) - 125g
Magnesium
Magnesium
Calcium
Calcium
Potassium
Potassium
Iron
Iron
Copper
Copper
Zinc
Zinc
Phosphorus
Phosphorus
Sodium
Sodium
Manganese
Manganese
Selenium
Selenium
5%
3.3%
5.7%
45%
15%
4.4%
10%
35%
24%
0%
8
100 g
300 g
1 oz - 28.35g 1 package (10 oz) - 284g
Magnesium
Magnesium
Calcium
Calcium
Potassium
Potassium
Iron
Iron
Copper
Copper
Zinc
Zinc
Phosphorus
Phosphorus
Sodium
Sodium
Manganese
Manganese
Selenium
Selenium
11%
18%
5.6%
83%
25%
11%
37%
98%
41%
125%
Vitamin Comparison
Vitamin comparison score is based on the number of vitamins by which one or the other food is richer. The "coverage" charts below show how much of the daily needs can be covered by 300 grams of the food.
3
100 g
300 g
1 oz - 28.35g 1 piece (1/6 of 8" pie) - 117g 1 piece (1/8 of 9" dia) - 125g
Vitamin C
Vit. C
Vitamin D
Vit. D
Vitamin A
Vit. A
Vitamin E
Vit. E
Vitamin B1
Vit. B1
Vitamin B2
Vit. B2
Vitamin B3
Vit. B3
Vitamin B5
Vit. B5
Vitamin B6
Vit. B6
Vitamin B12
Vit. B12
Vitamin K
Vit. K
Folate
Folate
11%
0%
9.7%
0%
34%
36%
21%
7.1%
8.8%
1.3%
0%
3%
6
100 g
300 g
1 oz - 28.35g 1 package (10 oz) - 284g
Vitamin C
Vit. C
Vitamin D
Vit. D
Vitamin A
Vit. A
Vitamin E
Vit. E
Vitamin B1
Vit. B1
Vitamin B2
Vit. B2
Vitamin B3
Vit. B3
Vitamin B5
Vit. B5
Vitamin B6
Vit. B6
Vitamin B12
Vit. B12
Vitamin K
Vit. K
Folate
Folate
0%
0%
0%
0%
98%
49%
51%
16%
15%
0%
0%
78%
All nutrients comparison - raw data values
Nutrient
DV% diff.
Selenium
22.9µg
42%
Monounsaturated fat
4.388g
17.887g
34%
Fats
11g
31.4g
31%
Folate
4µg
104µg
25%
Vitamin B1
0.134mg
0.392mg
22%
Sodium
266mg
753mg
21%
Saturated fat
3.797g
7.974g
19%
Calories
237kcal
518kcal
14%
Iron
1.21mg
2.22mg
13%
Polyunsaturated fat
2.198g
3.968g
12%
Protein
1.9g
6.9g
10%
Vitamin B3
1.123mg
2.727mg
10%
Phosphorus
24mg
86mg
9%
Carbs
34g
52.1g
6%
Fiber
1.6g
6%
Manganese
0.182mg
0.315mg
6%
Calcium
11mg
61mg
5%
Vitamin C
3.2mg
0mg
4%
Vitamin B2
0.158mg
0.213mg
4%
Copper
0.046mg
0.075mg
3%
Vitamin A
29µg
0µg
3%
Vitamin B5
0.119mg
0.268mg
3%
Magnesium
7mg
15mg
2%
Zinc
0.16mg
0.4mg
2%
Vitamin B6
0.038mg
0.064mg
2%
Protein per 100 calories
0.8g
1.3g
N/A
Calories per 10 g protein
1247kcal
751kcal
N/A
Weight per 100 calories
42g
19g
N/A
Unsaturated / Saturated Fat ratio
1.7
2.7
N/A
Net carbs
32.4g
52.1g
N/A
Potassium
65mg
64mg
0%
Vitamin B12
0.01µg
0µg
0%
Tryptophan
0.026mg
0.08mg
0%
Threonine
0.054mg
0.184mg
0%
Isoleucine
0.073mg
0.255mg
0%
Leucine
0.129mg
0.476mg
0%
Lysine
0.07mg
0.133mg
0%
Methionine
0.032mg
0.121mg
0%
Phenylalanine
0.088mg
0.339mg
0%
Valine
0.084mg
0.289mg
0%
Histidine
0.038mg
0.146mg
0%
Macronutrient Comparison
Macronutrient breakdown side-by-side comparison
1
2%
11%
34%
52%
Protein:
1.9 g
Fats:
11 g
Carbs:
34 g
Water:
52.2 g
Other:
0.9 g
4
7%
31%
52%
8%
2%
Protein:
6.9 g
Fats:
31.4 g
Carbs:
52.1 g
Water:
7.6 g
Other:
2 g
Contains
more
Water Water
+586.8%
Contains
more
Protein Protein
+263.2%
Contains
more
Fats Fats
+185.5%
Contains
more
Carbs Carbs
+53.2%
Contains
more
Other Other
+122.2%
Fat Type Comparison
Fat type breakdown side-by-side comparison
1
37%
42%
21%
Saturated fat:
Sat. Fat
3.797 g
Monounsaturated fat:
Mono. Fat
4.388 g
Polyunsaturated fat:
Poly. Fat
2.198 g
2
27%
60%
13%
Saturated fat:
Sat. Fat
7.974 g
Monounsaturated fat:
Mono. Fat
17.887 g
Polyunsaturated fat:
Poly. Fat
3.968 g
Contains
less
Sat. Fat Saturated fat
-52.4%
Contains
more
Mono. Fat Monounsaturated fat
+307.6%
Contains
more
Poly. Fat Polyunsaturated fat
+80.5%