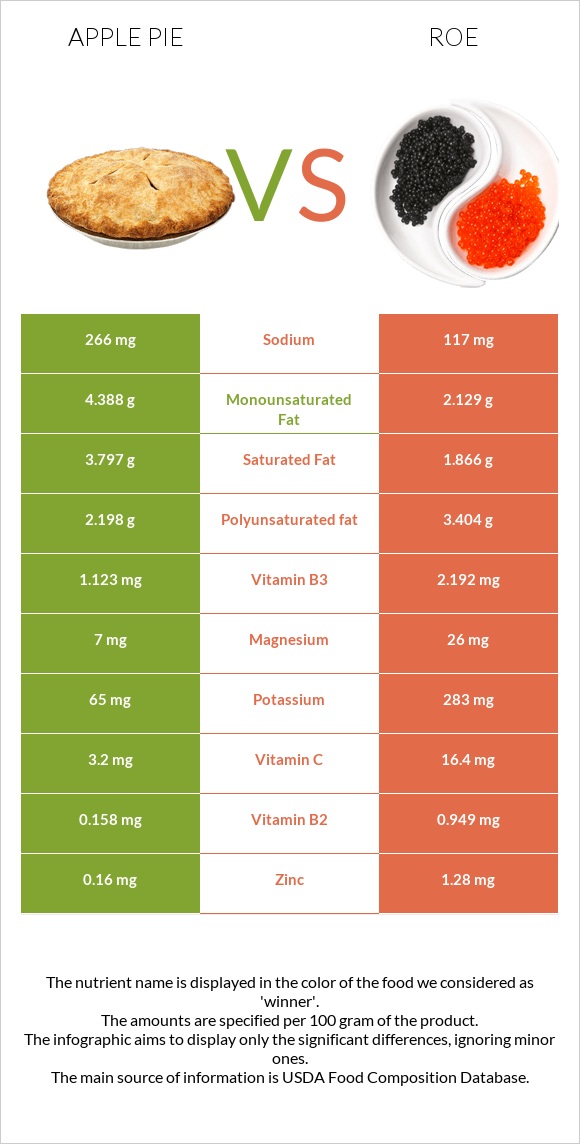
Significant differences between apple pie and roe The amount of vitamin B12, phosphorus, vitamin B2, folate, vitamin B5, vitamin C, vitamin B1, vitamin B6, and zinc in roe is higher than in apple pie. Roe covers your daily vitamin B12 needs 480% more than apple pie. Apple pie has a higher glycemic index. The glycemic index of apple pie is 41, while the glycemic index of roe is 27. Specific food types used in this comparison are Pie, apple, commercially prepared, unenriched flour and Fish, roe, mixed species, cooked, dry heat .
Infographic
Mineral Comparison
Mineral comparison score is based on the number of minerals by which one or the other food is richer. The "coverage" charts below show how much of the daily needs can be covered by 300 grams of the food.
2
100 g
300 g
1 oz - 28.35g 1 piece (1/6 of 8" pie) - 117g 1 piece (1/8 of 9" dia) - 125g
Magnesium
Magnesium
Calcium
Calcium
Potassium
Potassium
Iron
Iron
Copper
Copper
Zinc
Zinc
Phosphorus
Phosphorus
Sodium
Sodium
Manganese
Manganese
Selenium
Selenium
5%
3.3%
5.7%
45%
15%
4.4%
10%
35%
24%
0%
8
100 g
300 g
1 oz - 28.35g 3 oz - 85g
Magnesium
Magnesium
Calcium
Calcium
Potassium
Potassium
Iron
Iron
Copper
Copper
Zinc
Zinc
Phosphorus
Phosphorus
Sodium
Sodium
Manganese
Manganese
Selenium
Selenium
19%
8.4%
25%
29%
43%
35%
221%
15%
1.7%
282%
Vitamin Comparison
Vitamin comparison score is based on the number of vitamins by which one or the other food is richer. The "coverage" charts below show how much of the daily needs can be covered by 300 grams of the food.
0
100 g
300 g
1 oz - 28.35g 1 piece (1/6 of 8" pie) - 117g 1 piece (1/8 of 9" dia) - 125g
Vitamin C
Vit. C
Vitamin D
Vit. D
Vitamin A
Vit. A
Vitamin E
Vit. E
Vitamin B1
Vit. B1
Vitamin B2
Vit. B2
Vitamin B3
Vit. B3
Vitamin B5
Vit. B5
Vitamin B6
Vit. B6
Vitamin B12
Vit. B12
Vitamin K
Vit. K
Folate
Folate
11%
0%
9.7%
0%
34%
36%
21%
7.1%
8.8%
1.3%
0%
3%
9
100 g
300 g
1 oz - 28.35g 3 oz - 85g
Vitamin C
Vit. C
Vitamin D
Vit. D
Vitamin A
Vit. A
Vitamin E
Vit. E
Vitamin B1
Vit. B1
Vitamin B2
Vit. B2
Vitamin B3
Vit. B3
Vitamin B5
Vit. B5
Vitamin B6
Vit. B6
Vitamin B12
Vit. B12
Vitamin K
Vit. K
Folate
Folate
55%
0%
30%
0%
69%
219%
41%
69%
43%
1443%
0%
69%
All nutrients comparison - raw data values
Nutrient
DV% diff.
Vitamin B12
0.01µg
11.54µg
480%
Cholesterol
0mg
479mg
160%
Selenium
51.7µg
94%
Phosphorus
24mg
515mg
70%
Vitamin B2
0.158mg
0.949mg
61%
Protein
1.9g
28.62g
53%
Folate
4µg
92µg
22%
Vitamin B5
0.119mg
1.154mg
21%
Vitamin C
3.2mg
16.4mg
15%
Vitamin B1
0.134mg
0.277mg
12%
Carbs
34g
1.92g
11%
Vitamin B6
0.038mg
0.185mg
11%
Zinc
0.16mg
1.28mg
10%
Copper
0.046mg
0.128mg
9%
Saturated fat
3.797g
1.866g
9%
Polyunsaturated fat
2.198g
3.404g
8%
Vitamin A
29µg
91µg
7%
Manganese
0.182mg
0.013mg
7%
Vitamin B3
1.123mg
2.192mg
7%
Potassium
65mg
283mg
6%
Iron
1.21mg
0.77mg
6%
Fiber
1.6g
0g
6%
Sodium
266mg
117mg
6%
Monounsaturated fat
4.388g
2.129g
6%
Magnesium
7mg
26mg
5%
Fats
11g
8.23g
4%
Calories
237kcal
204kcal
2%
Calcium
11mg
28mg
2%
Protein per 100 calories
0.8g
14g
N/A
Calories per 10 g protein
1247kcal
71kcal
N/A
Weight per 100 calories
42g
49g
N/A
Unsaturated / Saturated Fat ratio
1.7
3
N/A
Net carbs
32.4g
1.92g
N/A
Tryptophan
0.026mg
0.375mg
0%
Threonine
0.054mg
1.305mg
0%
Isoleucine
0.073mg
1.465mg
0%
Leucine
0.129mg
2.509mg
0%
Lysine
0.07mg
2.179mg
0%
Methionine
0.032mg
0.71mg
0%
Phenylalanine
0.088mg
1.401mg
0%
Valine
0.084mg
1.676mg
0%
Histidine
0.038mg
0.778mg
0%
Omega-3 - EPA
1.26g
N/A
Omega-3 - DHA
1.747g
N/A
Omega-3 - DPA
0.105g
N/A
Macronutrient Comparison
Macronutrient breakdown side-by-side comparison
2
2%
11%
34%
52%
Protein:
1.9 g
Fats:
11 g
Carbs:
34 g
Water:
52.2 g
Other:
0.9 g
3
29%
8%
2%
59%
3%
Protein:
28.62 g
Fats:
8.23 g
Carbs:
1.92 g
Water:
58.63 g
Other:
2.6 g
Contains
more
Fats Fats
+33.7%
Contains
more
Carbs Carbs
+1670.8%
Contains
more
Protein Protein
+1406.3%
Contains
more
Water Water
+12.3%
Contains
more
Other Other
+188.9%
Fat Type Comparison
Fat type breakdown side-by-side comparison
1
37%
42%
21%
Saturated fat:
Sat. Fat
3.797 g
Monounsaturated fat:
Mono. Fat
4.388 g
Polyunsaturated fat:
Poly. Fat
2.198 g
2
25%
29%
46%
Saturated fat:
Sat. Fat
1.866 g
Monounsaturated fat:
Mono. Fat
2.129 g
Polyunsaturated fat:
Poly. Fat
3.404 g
Contains
more
Mono. Fat Monounsaturated fat
+106.1%
Contains
less
Sat. Fat Saturated fat
-50.9%
Contains
more
Poly. Fat Polyunsaturated fat
+54.9%