Bay leaf vs. Cumin — In-Depth Nutrition Comparison
Compare
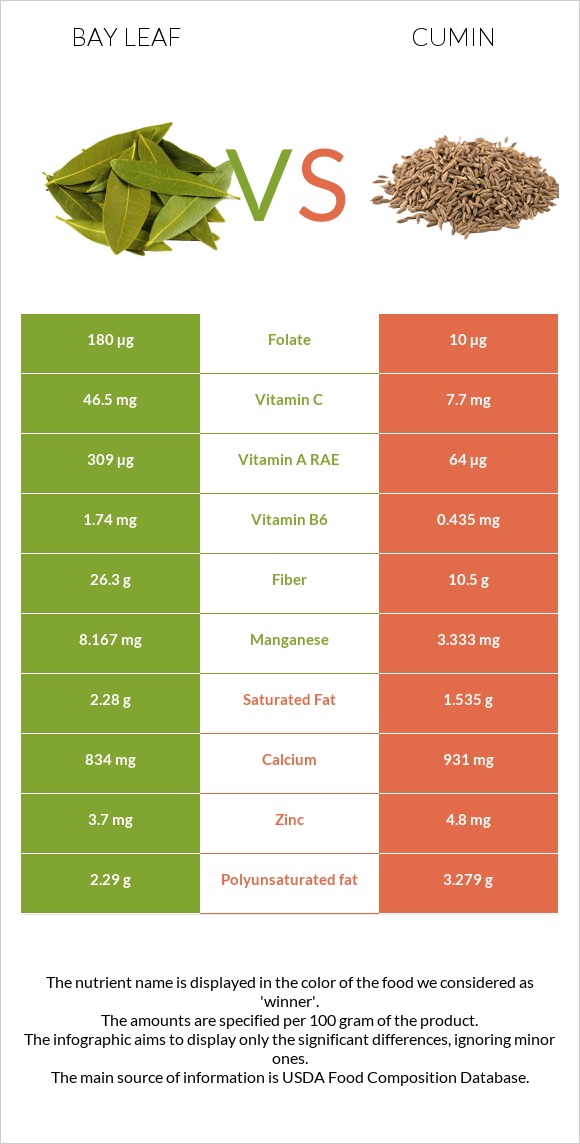
How are bay leaf and cumin different?
- Bay leaf is richer in manganese, vitamin B6, vitamin A, fiber, and vitamin C, while cumin is higher in iron, magnesium, phosphorus, vitamin B1, and copper.
- Cumin covers your daily need for iron, 292% more than bay leaf.
- Bay leaf contains 6 times more vitamin C than cumin. Bay leaf contains 46.5mg of vitamin C, while cumin contains 7.7mg.
Spices, bay leaf and Spices, cumin seed types were used in this article.
Infographic

Infographic link
Mineral Comparison
Mineral comparison score is based on the number of minerals by which one or the other food is richer. The "coverage" charts below show how much of the daily needs can be covered by 300 grams of the food.
Contains less SodiumSodium | -86.3% |
Contains more ManganeseManganese | +145% |
Contains more MagnesiumMagnesium | +205% |
Contains more CalciumCalcium | +11.6% |
Contains more PotassiumPotassium | +238% |
Contains more IronIron | +54.3% |
Contains more CopperCopper | +108.4% |
Contains more ZincZinc | +29.7% |
Contains more PhosphorusPhosphorus | +341.6% |
Contains more SeleniumSelenium | +85.7% |
Vitamin Comparison
Vitamin comparison score is based on the number of vitamins by which one or the other food is richer. The "coverage" charts below show how much of the daily needs can be covered by 300 grams of the food.
Contains more Vitamin CVitamin C | +503.9% |
Contains more Vitamin AVitamin A | +382.8% |
Contains more Vitamin B2Vitamin B2 | +28.7% |
Contains more Vitamin B6Vitamin B6 | +300% |
Contains more FolateFolate | +1700% |
Contains more Vitamin B1Vitamin B1 | +6877.8% |
Contains more Vitamin B3Vitamin B3 | +128.4% |
All nutrients comparison - raw data values
Nutrient | ![]() |
![]() |
DV% diff. |
Iron | 43mg | 66.36mg | 292% |
Manganese | 8.167mg | 3.333mg | 210% |
Vitamin B6 | 1.74mg | 0.435mg | 100% |
Fiber | 26.3g | 10.5g | 63% |
Magnesium | 120mg | 366mg | 59% |
Phosphorus | 113mg | 499mg | 55% |
Vitamin B1 | 0.009mg | 0.628mg | 52% |
Copper | 0.416mg | 0.867mg | 50% |
Vitamin C | 46.5mg | 7.7mg | 43% |
Folate | 180µg | 10µg | 43% |
Potassium | 529mg | 1788mg | 37% |
Monounsaturated fat | 1.64g | 14.04g | 31% |
Vitamin A | 309µg | 64µg | 27% |
Vitamin E | 3.33mg | 22% | |
Fats | 8.36g | 22.27g | 21% |
Protein | 7.61g | 17.81g | 20% |
Vitamin B3 | 2.005mg | 4.579mg | 16% |
Carbs | 74.97g | 44.24g | 10% |
Calcium | 834mg | 931mg | 10% |
Zinc | 3.7mg | 4.8mg | 10% |
Polyunsaturated fat | 2.29g | 3.279g | 7% |
Vitamin B2 | 0.421mg | 0.327mg | 7% |
Sodium | 23mg | 168mg | 6% |
Vitamin K | 5.4µg | 5% | |
Selenium | 2.8µg | 5.2µg | 4% |
Choline | 24.7mg | 4% | |
Saturated fat | 2.28g | 1.535g | 3% |
Calories | 313kcal | 375kcal | 3% |
Net carbs | 48.67g | 33.74g | N/A |
Sugar | 2.25g | N/A |
Macronutrient Comparison
Macronutrient breakdown side-by-side comparison
Contains more CarbsCarbs | +69.5% |
Contains more ProteinProtein | +134% |
Contains more FatsFats | +166.4% |
Contains more WaterWater | +48.2% |
Contains more OtherOther | +110.5% |
Fat Type Comparison
Fat type breakdown side-by-side comparison
Contains less Sat. FatSaturated fat | -32.7% |
Contains more Mono. FatMonounsaturated fat | +756.1% |
Contains more Poly. FatPolyunsaturated fat | +43.2% |