Green beans vs. Navy beans — Health Impact and Nutrition Comparison


Summary
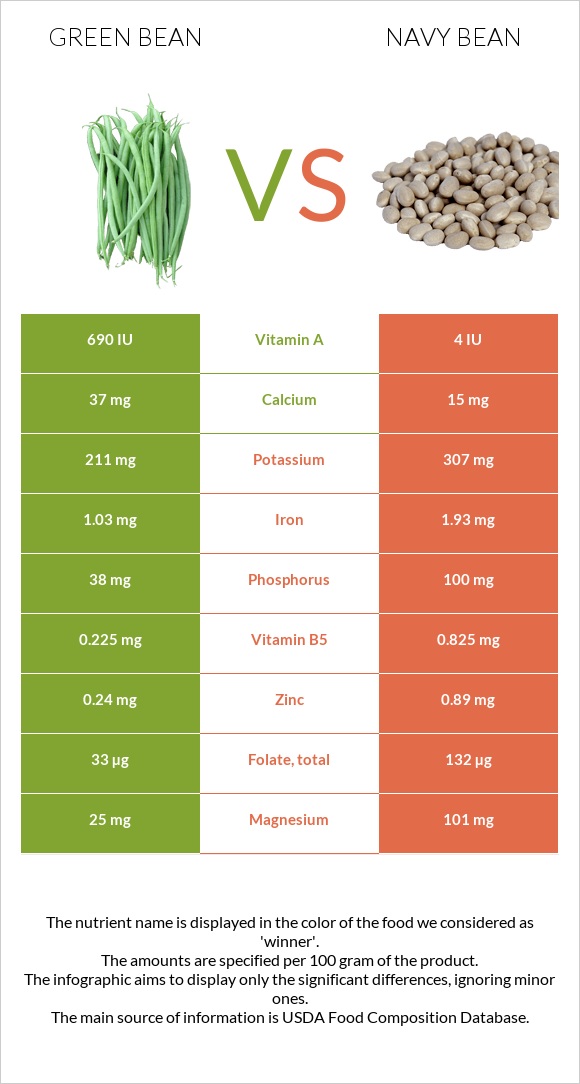
Navy beans provide several positive health impacts. Navy beans are richer in proteins, fibers, vitamin B1, B6, and folate, and it has a richer mineral composition. Navy beans are higher in carbs and calories. In comparison, green beans are richer in vitamins A, C, and K.
Introduction
This article is a comparison between 2 types of beans, navy beans and green beans. Navy beans are also known as haricot, and they are legumes, whereas green beans are pods.
We will focus mainly on the difference in their nutritional content and health impacts.
Nutritional content comparison
In this section, we will be considering 100g of each bean. They are both in cooked form.
Calories
Navy beans are higher in calories compared to green beans. Navy beans contain 4 times more calories than green beans.
Glycemic index
Green beans have a lower glycemic index compared to navy beans. Navy beans have double the glycemic index of green beans.
Carbs
Navy beans are significantly higher in carbs compared to green beans. Navy beans contain 26g of carbs per 100g. In comparison, green beans contain 8g of carbs.
Fibers
Navy beans are richer in fiber compared to green beans. Navy beans contain about 10.5g per 100g, whereas green beans contain 3.2g.
Protein
Navy beans are richer in proteins compared to green beans. Navy beans contain 8g of protein per 100g; in comparison, green beans contain 1.9g.
Fats
Their fat content is negligible. They contain less than 1g.
Minerals
Navy beans are richer in copper, zinc, phosphorus, potassium, magnesium, manganese, and iron.
Navy beans have a richer and more versatile mineral profile than green beans.
In the diagram below, we can visualize their distribution.
Mineral Comparison
Contains
more
MagnesiumMagnesium
+194.4%
Contains
more
CalciumCalcium
+56.8%
Contains
more
PotassiumPotassium
+166.4%
Contains
more
IronIron
+263.1%
Contains
more
CopperCopper
+268.4%
Contains
more
ZincZinc
+312%
Contains
more
PhosphorusPhosphorus
+396.6%
Contains
less
SodiumSodium
-100%
Contains
more
ManganeseManganese
+84.9%
Contains
more
SeleniumSelenium
+1350%
Vitamins
Navy beans are richer in all B1, B6, and folate. In comparison, green beans are richer in vitamin A,C and K.
In the diagram below, we can visualize their distribution.
Vitamin Comparison
Contains
more
Vitamin CVitamin C
+977.8%
Contains
more
Vitamin AVitamin A
+∞%
Contains
more
Vitamin EVitamin E
+4500%
Contains
more
Vitamin B2Vitamin B2
+47%
Contains
more
Vitamin KVitamin K
+7883.3%
Contains
more
Vitamin B1Vitamin B1
+220.3%
Contains
more
Vitamin B5Vitamin B5
+259.5%
Contains
more
Vitamin B6Vitamin B6
+146.4%
Contains
more
FolateFolate
+324.2%
Contains
more
CholineCholine
+164.5%
Health impacts
The health impact section will focus on these foods' different health impacts. We will be focusing on the differences rather than the common points.
Navy beans have a rich mineral profile that provides several health benefits.
Navy beans reduce the risk of developing iron-deficiency anemia since they are richer in iron. (1)
Copper in navy beans positively impacts bone health and overall metabolism. (2) (3)
The vitamin C content of navy beans has antioxidative properties and reduces damage caused by oxidative stress. (4)
Gut health
Navy beans are rich in fiber which has positive effects on gastrointestinal health. It may decrease the risk of diverticulosis and improve gut microbiota and overall health. (5)
Cardiovascular health and metabolism
Green beans are richer in vitamin K, which provides several health benefits, such as decreasing cardiovascular mortality risks and reducing arterial calcifications. In addition to the cardiovascular benefits, it reduces the risks of diabetes development and osteoporosis. However, vitamin K intake should be monitored while taking anticoagulant medications. (6)(7)(8)
In parallel, the consumption of navy beans that are richer in fiber is linked with decreased risks of diabetes and cardiovascular diseases. (5)
References
- https://www.ncbi.nlm.nih.gov/pmc/articles/PMC3999603/
- https://pubmed.ncbi.nlm.nih.gov/34210051/
- https://pubmed.ncbi.nlm.nih.gov/26097228/
- https://pubmed.ncbi.nlm.nih.gov/17173758/
- https://pubmed.ncbi.nlm.nih.gov/19335713/
- https://pubmed.ncbi.nlm.nih.gov/34439410/
- https://www.ncbi.nlm.nih.gov/pmc/articles/PMC4600246/
- https://pubmed.ncbi.nlm.nih.gov/15825811/

Infographic
All nutrients comparison - raw data values
| Nutrient | |
|
DV% diff. |
| Vitamin K | 47.9µg | 0.6µg | 39% |
| Fiber | 3.2g | 10.5g | 29% |
| Folate | 33µg | 140µg | 27% |
| Iron | 0.65mg | 2.36mg | 21% |
| Copper | 0.057mg | 0.21mg | 17% |
| Phosphorus | 29mg | 144mg | 16% |
| Vitamin B1 | 0.074mg | 0.237mg | 14% |
| Protein | 1.89g | 8.23g | 13% |
| Manganese | 0.285mg | 0.527mg | 11% |
| Vitamin C | 9.7mg | 0.9mg | 10% |
| Magnesium | 18mg | 53mg | 8% |
| Potassium | 146mg | 389mg | 7% |
| Zinc | 0.25mg | 1.03mg | 7% |
| Vitamin B6 | 0.056mg | 0.138mg | 6% |
| Carbs | 7.88g | 26.05g | 6% |
| Starch | 15.4g | 6% | |
| Choline | 16.9mg | 44.7mg | 5% |
| Selenium | 0.2µg | 2.9µg | 5% |
| Calories | 35kcal | 140kcal | 5% |
| Vitamin B5 | 0.074mg | 0.266mg | 4% |
| Vitamin A | 32µg | 0µg | 4% |
| Vitamin E | 0.46mg | 0.01mg | 3% |
| Calcium | 44mg | 69mg | 3% |
| Polyunsaturated fat | 0.145g | 0.49g | 2% |
| Vitamin B2 | 0.097mg | 0.066mg | 2% |
| Fats | 0.28g | 0.62g | 1% |
| Net carbs | 4.68g | 15.55g | N/A |
| Sugar | 3.63g | 0.37g | N/A |
| Sodium | 1mg | 0mg | 0% |
| Vitamin B3 | 0.614mg | 0.649mg | 0% |
| Saturated fat | 0.064g | 0.098g | 0% |
| Monounsaturated fat | 0.011g | 0.142g | 0% |
| Tryptophan | 0.02mg | 0.1mg | 0% |
| Threonine | 0.082mg | 0.289mg | 0% |
| Isoleucine | 0.069mg | 0.387mg | 0% |
| Leucine | 0.116mg | 0.7mg | 0% |
| Lysine | 0.091mg | 0.52mg | 0% |
| Methionine | 0.023mg | 0.111mg | 0% |
| Phenylalanine | 0.069mg | 0.471mg | 0% |
| Valine | 0.093mg | 0.504mg | 0% |
| Histidine | 0.035mg | 0.206mg | 0% |
| Omega-3 - ALA | 0.177g | N/A |
Macronutrient Comparison
| Contains more WaterWater | +39.8% |
| Contains more ProteinProtein | +335.4% |
| Contains more FatsFats | +121.4% |
| Contains more CarbsCarbs | +230.6% |
| Contains more OtherOther | +76.7% |
Fat Type Comparison
| Contains less Sat. FatSaturated fat | -34.7% |
| Contains more Mono. FatMonounsaturated fat | +1190.9% |
| Contains more Poly. FatPolyunsaturated fat | +237.9% |
People also compare


References
All the values for which the sources are not specified explicitly are taken from FDA’s Food Central. The exact link to the food presented on this page can be found below.
- Green beans - https://fdc.nal.usda.gov/fdc-app.html#/food-details/169141/nutrients
- Navy beans - https://fdc.nal.usda.gov/fdc-app.html#/food-details/173746/nutrients
All the Daily Values are presented for males aged 31-50, for 2000-calorie diets.