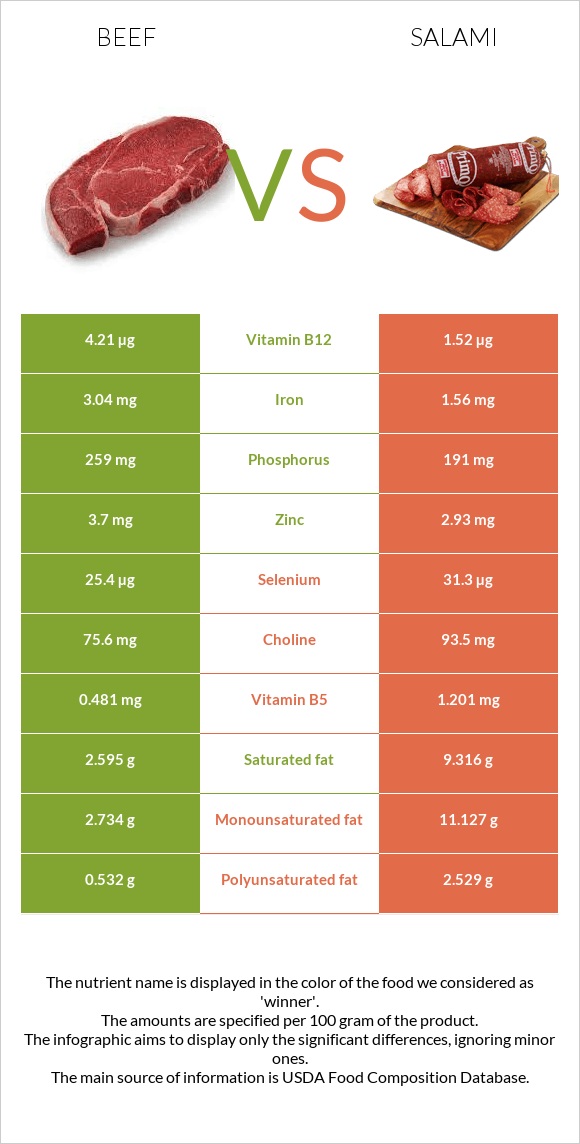
What are the main differences between beef and salami? Beef is richer in vitamin B12, iron, and vitamin B6, while salami is higher in manganese, copper, vitamin B1, vitamin B5, and selenium. Beef's daily need coverage for vitamin B12 is 112% higher. Salami has 2 times less iron than beef. Beef has 3.04mg of iron, while salami has 1.56mg. Beef is lower in saturated fat. Salami has a higher glycemic index (28) than beef (0). We used Beef, loin, tenderloin roast, separable lean only, boneless, trimmed to 0" fat, select, cooked, roasted and Salami, cooked, beef, and pork types in this comparison.
Infographic
Mineral Comparison
Mineral comparison score is based on the number of minerals by which one or the other food is richer. The "coverage" charts below show how much of the daily needs can be covered by 300 grams of the food.
5
100 g
300 g
3 oz - 85g 1 roast - 487g
Magnesium
Magnesium
Calcium
Calcium
Potassium
Potassium
Iron
Iron
Copper
Copper
Zinc
Zinc
Phosphorus
Phosphorus
Sodium
Sodium
Manganese
Manganese
Selenium
Selenium
10%
3.9%
31%
114%
32%
101%
111%
7%
1.2%
139%
5
100 g
300 g
1 slice round - 12.3g
Magnesium
Magnesium
Calcium
Calcium
Potassium
Potassium
Iron
Iron
Copper
Copper
Zinc
Zinc
Phosphorus
Phosphorus
Sodium
Sodium
Manganese
Manganese
Selenium
Selenium
14%
4.5%
28%
59%
119%
80%
82%
227%
128%
171%
Vitamin Comparison
Vitamin comparison score is based on the number of vitamins by which one or the other food is richer. The "coverage" charts below show how much of the daily needs can be covered by 300 grams of the food.
6
100 g
300 g
3 oz - 85g 1 roast - 487g
Vitamin C
Vit. C
Vitamin D
Vit. D
Vitamin A
Vit. A
Vitamin E
Vit. E
Vitamin B1
Vit. B1
Vitamin B2
Vit. B2
Vitamin B3
Vit. B3
Vitamin B5
Vit. B5
Vitamin B6
Vit. B6
Vitamin B12
Vit. B12
Vitamin K
Vit. K
Folate
Folate
0%
1.5%
0.67%
5%
19%
92%
108%
29%
154%
526%
4%
5.3%
4
100 g
300 g
1 slice round - 12.3g
Vitamin C
Vit. C
Vitamin D
Vit. D
Vitamin A
Vit. A
Vitamin E
Vit. E
Vitamin B1
Vit. B1
Vitamin B2
Vit. B2
Vitamin B3
Vit. B3
Vitamin B5
Vit. B5
Vitamin B6
Vit. B6
Vitamin B12
Vit. B12
Vitamin K
Vit. K
Folate
Folate
0%
15%
0%
4.4%
92%
82%
113%
72%
106%
190%
8%
2.3%
All nutrients comparison - raw data values
Nutrient
DV% diff.
Vitamin B12
4.21µg
1.52µg
112%
Sodium
54mg
1740mg
73%
Manganese
0.009mg
0.978mg
42%
Saturated fat
2.595g
9.316g
31%
Fats
6.54g
25.9g
30%
Copper
0.097mg
0.357mg
29%
Vitamin B1
0.074mg
0.367mg
24%
Monounsaturated fat
2.734g
11.127g
21%
Iron
3.04mg
1.56mg
19%
Vitamin B6
0.669mg
0.459mg
16%
Vitamin B5
0.481mg
1.201mg
14%
Polyunsaturated fat
0.532g
2.529g
13%
Protein
27.55g
21.85g
11%
Selenium
25.4µg
31.3µg
11%
Phosphorus
259mg
191mg
10%
Calories
169kcal
336kcal
8%
Zinc
3.7mg
2.93mg
7%
Vitamin D*
3 IU
41 IU
5%
Vitamin D
0.1µg
1µg
5%
Vitamin B2
0.4mg
0.357mg
3%
Choline
75.6mg
93.5mg
3%
Vitamin B3
5.76mg
6.053mg
2%
Carbs
0g
2.4g
1%
Cholesterol
85mg
89mg
1%
Magnesium
14mg
19mg
1%
Potassium
352mg
316mg
1%
Vitamin K
1.6µg
3.2µg
1%
Folate
7µg
3µg
1%
Protein per 100 calories
16g
6.5g
N/A
Calories per 10 g protein
61kcal
154kcal
N/A
Weight per 100 calories
59g
30g
N/A
Unsaturated / Saturated Fat ratio
1.3
1.5
N/A
Net carbs
0g
2.4g
N/A
Calcium
13mg
15mg
0%
Sugar
0g
0.96g
N/A
Vitamin A
2µg
0µg
0%
Vitamin E
0.25mg
0.22mg
0%
Trans fat
0.375g
0.586g
N/A
Tryptophan
0.359mg
0.114mg
0%
Threonine
1.534mg
0.521mg
0%
Isoleucine
1.52mg
0.675mg
0%
Leucine
2.833mg
0.929mg
0%
Lysine
3.178mg
1.107mg
0%
Methionine
0.871mg
0.301mg
0%
Phenylalanine
1.299mg
0.481mg
0%
Valine
1.603mg
0.668mg
0%
Histidine
1.244mg
0.359mg
0%
Omega-3 - EPA
0.002g
0g
N/A
Omega-3 - DHA
0.002g
0g
N/A
Omega-3 - ALA
0.013g
0.126g
N/A
Omega-3 - DPA
0.011g
0g
N/A
Omega-6 - Dihomo-gamma-linoleic acid
0.017g
N/A
Omega-6 - Eicosadienoic acid
0.002g
0.084g
N/A
Omega-6 - Linoleic acid
0.349g
2.104g
N/A
Macronutrient Comparison
Macronutrient breakdown side-by-side comparison
2
28%
7%
66%
Protein:
27.55 g
Fats:
6.54 g
Carbs:
0 g
Water:
65.71 g
Other:
0.2 g
3
22%
26%
2%
45%
5%
Protein:
21.85 g
Fats:
25.9 g
Carbs:
2.4 g
Water:
45.19 g
Other:
4.66 g
Contains
more
Protein Protein
+26.1%
Contains
more
Water Water
+45.4%
Contains
more
Fats Fats
+296%
Contains
more
Carbs Carbs
+∞%
Contains
more
Other Other
+2230%
Fat Type Comparison
Fat type breakdown side-by-side comparison
1
44%
47%
9%
Saturated fat:
Sat. Fat
2.595 g
Monounsaturated fat:
Mono. Fat
2.734 g
Polyunsaturated fat:
Poly. Fat
0.532 g
2
41%
48%
11%
Saturated fat:
Sat. Fat
9.316 g
Monounsaturated fat:
Mono. Fat
11.127 g
Polyunsaturated fat:
Poly. Fat
2.529 g
Contains
less
Sat. Fat Saturated fat
-72.1%
Contains
more
Mono. Fat Monounsaturated fat
+307%
Contains
more
Poly. Fat Polyunsaturated fat
+375.4%