Infographic
Mineral Comparison
Mineral comparison score is based on the number of minerals by which one or the other food is richer. The "coverage" charts below show how much of the daily needs can be covered by 300 grams of the food.
4
100 g
300 g
1 cup (8 fl oz) - 247g 1 can (11 oz), prepared - 600g
Magnesium
Magnesium
Calcium
Calcium
Potassium
Potassium
Iron
Iron
Copper
Copper
Zinc
Zinc
Phosphorus
Phosphorus
Sodium
Sodium
Manganese
Manganese
Selenium
Selenium
2.9%
4.8%
15%
12%
17%
6.5%
10%
55%
14%
0%
4
100 g
300 g
0.25 tsp - 1.2g 1 tsp - 4.7g
Magnesium
Magnesium
Calcium
Calcium
Potassium
Potassium
Iron
Iron
Copper
Copper
Zinc
Zinc
Phosphorus
Phosphorus
Sodium
Sodium
Manganese
Manganese
Selenium
Selenium
8.6%
3.6%
11%
44%
25%
4.4%
9.9%
83%
14%
2.7%
Vitamin Comparison
Vitamin comparison score is based on the number of vitamins by which one or the other food is richer. The "coverage" charts below show how much of the daily needs can be covered by 300 grams of the food.
2
100 g
300 g
1 cup (8 fl oz) - 247g 1 can (11 oz), prepared - 600g
Vitamin C
Vit. C
Vitamin D
Vit. D
Vitamin A
Vit. A
Vitamin E
Vit. E
Vitamin B1
Vit. B1
Vitamin B2
Vit. B2
Vitamin B3
Vit. B3
Vitamin B5
Vit. B5
Vitamin B6
Vit. B6
Vitamin B12
Vit. B12
Vitamin K
Vit. K
Folate
Folate
8%
0%
6%
0%
6.8%
6.7%
8.7%
3%
8.3%
0%
0%
4.5%
8
100 g
300 g
0.25 tsp - 1.2g 1 tsp - 4.7g
Vitamin C
Vit. C
Vitamin D
Vit. D
Vitamin A
Vit. A
Vitamin E
Vit. E
Vitamin B1
Vit. B1
Vitamin B2
Vit. B2
Vitamin B3
Vit. B3
Vitamin B5
Vit. B5
Vitamin B6
Vit. B6
Vitamin B12
Vit. B12
Vitamin K
Vit. K
Folate
Folate
15%
0%
27%
0.2%
8%
19%
3.3%
6.6%
36%
0%
0.5%
0.75%
All nutrients comparison - raw data values
Nutrient
DV% diff.
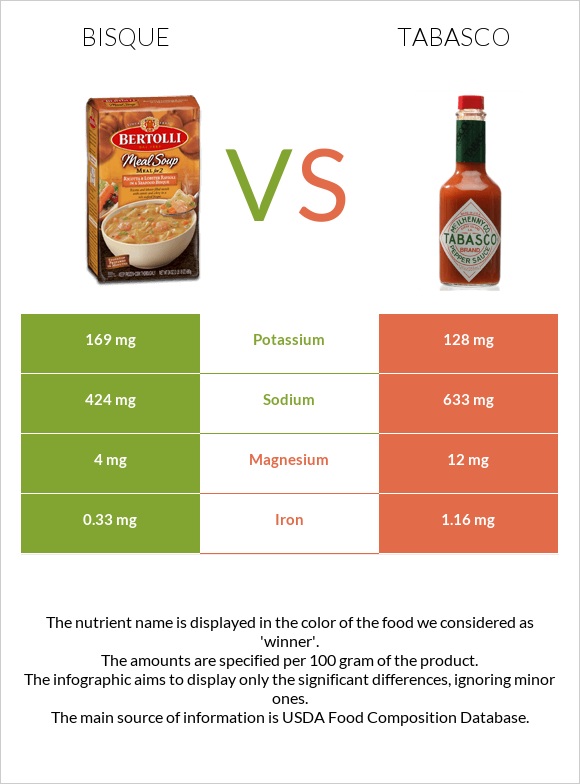
Iron
0.33mg
1.16mg
10%
Sodium
424mg
633mg
9%
Vitamin B6
0.036mg
0.154mg
9%
Vitamin A
18µg
82µg
7%
Vitamin B2
0.029mg
0.084mg
4%
Carbs
9.6g
0.8g
3%
Copper
0.052mg
0.075mg
3%
Calories
50kcal
12kcal
2%
Vitamin C
2.4mg
4.5mg
2%
Magnesium
4mg
12mg
2%
Fiber
0.2g
0.6g
2%
Vitamin B3
0.465mg
0.178mg
2%
Protein
0.92g
1.29g
1%
Cholesterol
2mg
0mg
1%
Potassium
169mg
128mg
1%
Zinc
0.24mg
0.16mg
1%
Selenium
0.5µg
1%
Vitamin B5
0.05mg
0.11mg
1%
Folate
6µg
1µg
1%
Saturated fat
0.22g
0.106g
1%
Monounsaturated fat
0.28g
0.061g
1%
Protein per 100 calories
1.8g
11g
N/A
Calories per 10 g protein
543kcal
93kcal
N/A
Weight per 100 calories
200g
833g
N/A
Fats
1.02g
0.76g
0%
Net carbs
9.4g
0.2g
N/A
Calcium
16mg
12mg
0%
Sugar
0.13g
N/A
Phosphorus
24mg
23mg
0%
Vitamin E
0.01mg
0%
Manganese
0.104mg
0.107mg
0%
Vitamin B1
0.027mg
0.032mg
0%
Vitamin K
0.2µg
0%
Polyunsaturated fat
0.45g
0.401g
0%
Tryptophan
0.009mg
0.017mg
0%
Threonine
0.027mg
0.048mg
0%
Isoleucine
0.031mg
0.042mg
0%
Leucine
0.051mg
0.068mg
0%
Lysine
0.036mg
0.057mg
0%
Methionine
0.012mg
0.016mg
0%
Phenylalanine
0.031mg
0.04mg
0%
Valine
0.035mg
0.055mg
0%
Histidine
0.018mg
0.026mg
0%
Macronutrient Comparison
Macronutrient breakdown side-by-side comparison
2
10%
87%
Protein:
0.92 g
Fats:
1.02 g
Carbs:
9.6 g
Water:
87.17 g
Other:
1.29 g
3
95%
2%
Protein:
1.29 g
Fats:
0.76 g
Carbs:
0.8 g
Water:
95.17 g
Other:
1.98 g
Contains
more
Fats Fats
+34.2%
Contains
more
Carbs Carbs
+1100%
Contains
more
Protein Protein
+40.2%
Contains
more
Other Other
+53.5%
Fat Type Comparison
Fat type breakdown side-by-side comparison
2
23%
29%
47%
Saturated fat:
Sat. Fat
0.22 g
Monounsaturated fat:
Mono. Fat
0.28 g
Polyunsaturated fat:
Poly. Fat
0.45 g
1
19%
11%
71%
Saturated fat:
Sat. Fat
0.106 g
Monounsaturated fat:
Mono. Fat
0.061 g
Polyunsaturated fat:
Poly. Fat
0.401 g
Contains
more
Mono. Fat Monounsaturated fat
+359%
Contains
more
Poly. Fat Polyunsaturated fat
+12.2%
Contains
less
Sat. Fat Saturated fat
-51.8%