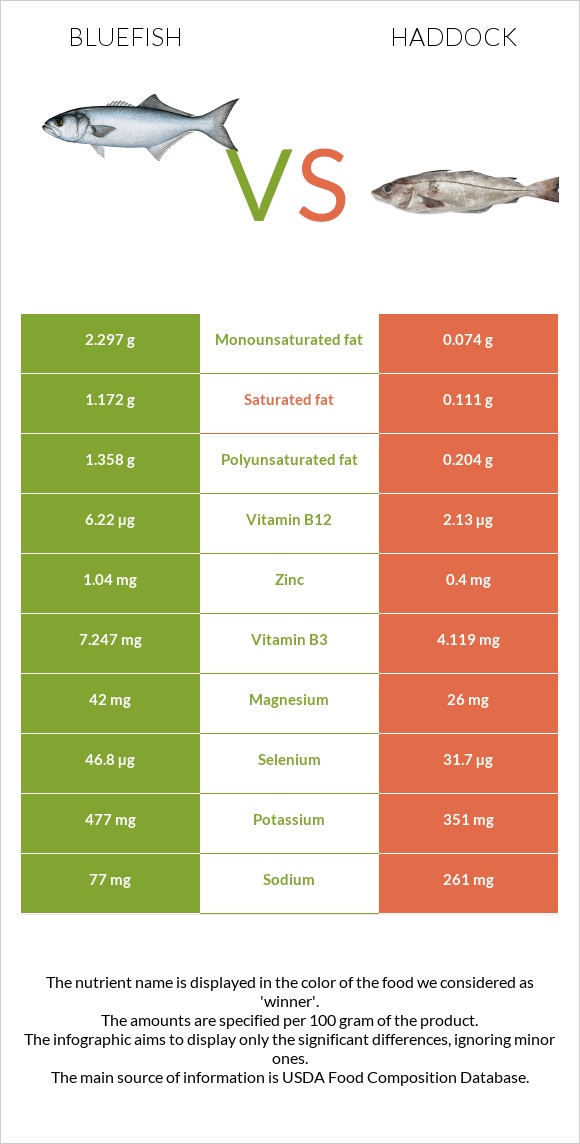
Summary of differences between bluefish and haddock Haddock has less vitamin B12, selenium, vitamin B3, vitamin B6, vitamin B5, vitamin A, zinc, and iron than bluefish. Bluefish covers your daily need for vitamin B12, 170% more than haddock. Bluefish has 11 times more saturated fat than haddock. While bluefish has 1.172g of saturated fat, haddock has only 0.111g. These are the specific foods used in this comparison Fish, bluefish, cooked, dry heat and Fish, haddock, cooked, dry heat .
Infographic
Mineral Comparison
Mineral comparison score is based on the number of minerals by which one or the other food is richer. The "coverage" charts below show how much of the daily needs can be covered by 300 grams of the food.
8
100 g
300 g
3 oz - 85g 1 fillet - 117g
Magnesium
Magnesium
Calcium
Calcium
Potassium
Potassium
Iron
Iron
Copper
Copper
Zinc
Zinc
Phosphorus
Phosphorus
Sodium
Sodium
Manganese
Manganese
Selenium
Selenium
30%
2.7%
42%
23%
23%
28%
125%
10%
3.5%
255%
1
100 g
300 g
3 oz - 85g 1 fillet - 150g
Magnesium
Magnesium
Calcium
Calcium
Potassium
Potassium
Iron
Iron
Copper
Copper
Zinc
Zinc
Phosphorus
Phosphorus
Sodium
Sodium
Manganese
Manganese
Selenium
Selenium
19%
4.2%
31%
7.9%
8.7%
11%
119%
34%
1.7%
173%
Vitamin Comparison
Vitamin comparison score is based on the number of vitamins by which one or the other food is richer. The "coverage" charts below show how much of the daily needs can be covered by 300 grams of the food.
7
100 g
300 g
3 oz - 85g 1 fillet - 117g
Vitamin C
Vit. C
Vitamin D
Vit. D
Vitamin A
Vit. A
Vitamin E
Vit. E
Vitamin B1
Vit. B1
Vitamin B2
Vit. B2
Vitamin B3
Vit. B3
Vitamin B5
Vit. B5
Vitamin B6
Vit. B6
Vitamin B12
Vit. B12
Vitamin K
Vit. K
Folate
Folate
0%
0%
46%
0%
17%
22%
136%
57%
107%
778%
0%
1.5%
4
100 g
300 g
3 oz - 85g 1 fillet - 150g
Vitamin C
Vit. C
Vitamin D
Vit. D
Vitamin A
Vit. A
Vitamin E
Vit. E
Vitamin B1
Vit. B1
Vitamin B2
Vit. B2
Vitamin B3
Vit. B3
Vitamin B5
Vit. B5
Vitamin B6
Vit. B6
Vitamin B12
Vit. B12
Vitamin K
Vit. K
Folate
Folate
0%
9%
7%
11%
5.8%
16%
77%
30%
75%
266%
0.25%
9.8%
All nutrients comparison - raw data values
Nutrient
DV% diff.
Vitamin B12
6.22µg
2.13µg
170%
Selenium
46.8µg
31.7µg
27%
Vitamin B3
7.247mg
4.119mg
20%
Choline
79.6mg
14%
Vitamin A
138µg
21µg
13%
Protein
25.69g
19.99g
11%
Vitamin B6
0.464mg
0.327mg
11%
Vitamin B5
0.955mg
0.494mg
9%
Fats
5.44g
0.55g
8%
Sodium
77mg
261mg
8%
Polyunsaturated fat
1.358g
0.204g
8%
Zinc
1.04mg
0.4mg
6%
Monounsaturated fat
2.297g
0.074g
6%
Iron
0.62mg
0.21mg
5%
Copper
0.068mg
0.026mg
5%
Saturated fat
1.172g
0.111g
5%
Magnesium
42mg
26mg
4%
Potassium
477mg
351mg
4%
Vitamin E
0.55mg
4%
Vitamin B1
0.067mg
0.023mg
4%
Calories
159kcal
90kcal
3%
Cholesterol
76mg
66mg
3%
Vitamin D*
23 IU
3%
Vitamin D
0.6µg
3%
Folate
2µg
13µg
3%
Phosphorus
291mg
278mg
2%
Vitamin B2
0.097mg
0.069mg
2%
Calcium
9mg
14mg
1%
Manganese
0.027mg
0.013mg
1%
Protein per 100 calories
16g
22g
N/A
Calories per 10 g protein
62kcal
45kcal
N/A
Weight per 100 calories
63g
111g
N/A
Unsaturated / Saturated Fat ratio
3.1
2.5
N/A
Vitamin K
0.1µg
0%
Trans fat
0.005g
N/A
Tryptophan
0.288mg
0.26mg
0%
Threonine
1.126mg
1.015mg
0%
Isoleucine
1.184mg
1.067mg
0%
Leucine
2.088mg
1.882mg
0%
Lysine
2.36mg
2.126mg
0%
Methionine
0.76mg
0.686mg
0%
Phenylalanine
1.003mg
0.904mg
0%
Valine
1.324mg
1.193mg
0%
Histidine
0.756mg
0.682mg
0%
Omega-3 - EPA
0.323g
0.051g
N/A
Omega-3 - DHA
0.665g
0.109g
N/A
Omega-3 - DPA
0.079g
0.006g
N/A
Omega-6 - Eicosadienoic acid
0.001g
N/A
Macronutrient Comparison
Macronutrient breakdown side-by-side comparison
3
26%
5%
63%
6%
Protein:
25.69 g
Fats:
5.44 g
Carbs:
0 g
Water:
62.64 g
Other:
6.23 g
1
20%
79%
Protein:
19.99 g
Fats:
0.55 g
Carbs:
0 g
Water:
79.65 g
Other:
0 g
Contains
more
Protein Protein
+28.5%
Contains
more
Fats Fats
+889.1%
Contains
more
Other Other
+∞%
Contains
more
Water Water
+27.2%
Fat Type Comparison
Fat type breakdown side-by-side comparison
2
24%
48%
28%
Saturated fat:
Sat. Fat
1.172 g
Monounsaturated fat:
Mono. Fat
2.297 g
Polyunsaturated fat:
Poly. Fat
1.358 g
1
29%
19%
52%
Saturated fat:
Sat. Fat
0.111 g
Monounsaturated fat:
Mono. Fat
0.074 g
Polyunsaturated fat:
Poly. Fat
0.204 g
Contains
more
Mono. Fat Monounsaturated fat
+3004.1%
Contains
more
Poly. Fat Polyunsaturated fat
+565.7%
Contains
less
Sat. Fat Saturated fat
-90.5%